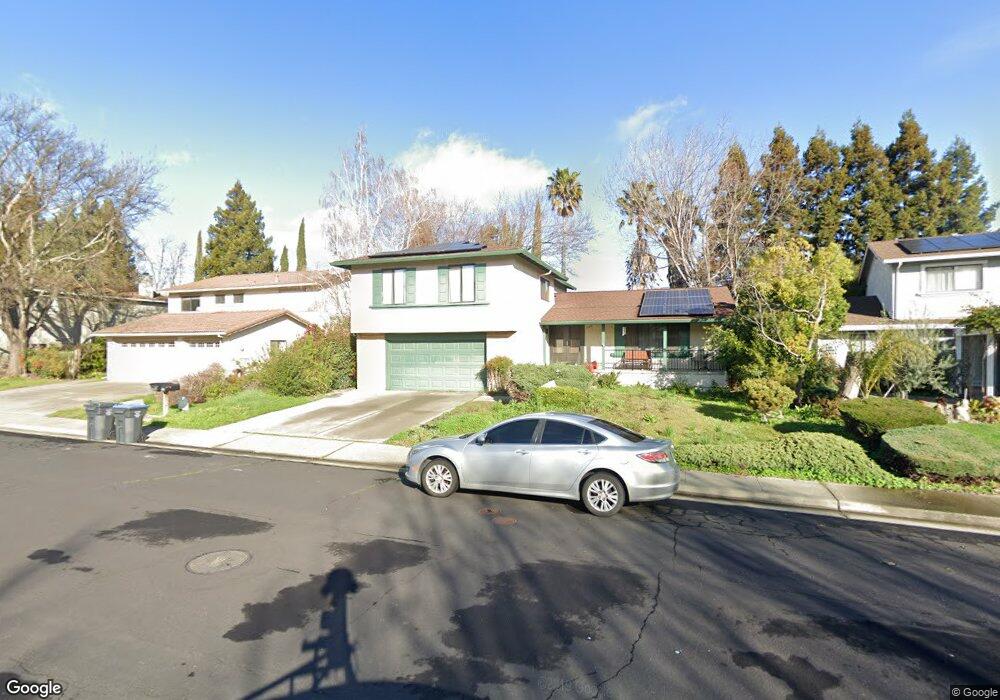
542 Americano Way Fairfield, CA 94533
Estimated Value: $644,000 - $689,000
4
Beds
3
Baths
2,253
Sq Ft
$292/Sq Ft
Est. Value
About This Home
This home is located at 542 Americano Way, Fairfield, CA 94533 and is currently estimated at $657,802, approximately $291 per square foot. 542 Americano Way is a home located in Solano County with nearby schools including Rolling Hills Elementary School, Fairfield High School, and Fairfield Christian School.
Ownership History
Date
Name
Owned For
Owner Type
Purchase Details
Closed on
Oct 28, 2015
Sold by
Wright Kendall J
Bought by
Johnson Misti L
Current Estimated Value
Home Financials for this Owner
Home Financials are based on the most recent Mortgage that was taken out on this home.
Original Mortgage
$388,170
Outstanding Balance
$305,522
Interest Rate
3.81%
Mortgage Type
VA
Estimated Equity
$352,280
Purchase Details
Closed on
May 14, 2013
Sold by
Wright Kendall J
Bought by
Wright Kendall J
Home Financials for this Owner
Home Financials are based on the most recent Mortgage that was taken out on this home.
Original Mortgage
$215,700
Interest Rate
3.38%
Mortgage Type
New Conventional
Purchase Details
Closed on
Nov 18, 2004
Sold by
Wright Kendall J and Wright Susan P
Bought by
Wright Kendall J and Wright Susan P
Create a Home Valuation Report for This Property
The Home Valuation Report is an in-depth analysis detailing your home's value as well as a comparison with similar homes in the area
Home Values in the Area
Average Home Value in this Area
Purchase History
| Date | Buyer | Sale Price | Title Company |
|---|---|---|---|
| Johnson Misti L | $380,000 | Placer Title Company | |
| Wright Kendall J | -- | Accommodation | |
| Wright Kendall J | -- | Orange Coast Title | |
| Wright Kendall J | -- | -- |
Source: Public Records
Mortgage History
| Date | Status | Borrower | Loan Amount |
|---|---|---|---|
| Open | Johnson Misti L | $388,170 | |
| Previous Owner | Wright Kendall J | $215,700 |
Source: Public Records
Tax History Compared to Growth
Tax History
| Year | Tax Paid | Tax Assessment Tax Assessment Total Assessment is a certain percentage of the fair market value that is determined by local assessors to be the total taxable value of land and additions on the property. | Land | Improvement |
|---|---|---|---|---|
| 2025 | $4,948 | $449,838 | $100,620 | $349,218 |
| 2024 | $4,948 | $441,019 | $98,648 | $342,371 |
| 2023 | $4,794 | $432,372 | $96,714 | $335,658 |
| 2022 | $4,734 | $423,895 | $94,818 | $329,077 |
| 2021 | $4,686 | $415,584 | $92,959 | $322,625 |
| 2020 | $4,575 | $411,323 | $92,006 | $319,317 |
| 2019 | $4,461 | $403,258 | $90,202 | $313,056 |
| 2018 | $8,206 | $395,352 | $88,434 | $306,918 |
| 2017 | $7,993 | $387,600 | $86,700 | $300,900 |
| 2016 | $4,356 | $380,000 | $85,000 | $295,000 |
| 2015 | $2,571 | $238,640 | $56,857 | $181,783 |
| 2014 | $2,546 | $233,967 | $55,744 | $178,223 |
Source: Public Records
Map
Nearby Homes
- 3265 Arroyo Dr
- 2532 Cyan Dr
- 2462 Shore Vista Unit 4752
- 3276 Arroyo Dr
- 523 El Camino Dr
- 3101 Arroyo Ct
- 675 Hillside Dr
- 743 Isabella Way
- 705 Otter Ct
- 558 Maywood Way
- 727 Shamrock Ct
- 738 Marsh Place
- 722 Rosemary Ct
- 960 Suffolk Way
- 703 Mustang Ct
- 2924 Redwood Dr
- 3087 Pecan Cir
- 3442 Glen Ellen Dr
- 2827 Sunburst Dr
- 2915 N Texas St Unit 219
- 536 Americano Way
- 548 Americano Way
- 3269 Arroyo Dr
- 3261 Arroyo Dr
- 530 Americano Way
- 554 Americano Way
- 3117 Americano Ct
- 555 Americano Way
- 3257 Arroyo Dr
- 524 Americano Way
- 560 Americano Way
- 529 Americano Way
- 3253 Arroyo Dr
- 3277 Arroyo Dr
- 561 Americano Way
- 3111 Americano Ct
- 518 Americano Way
- 566 Americano Way
- 3268 Arroyo Dr
- 3249 Arroyo Dr