542 E Maple St River Falls, WI 54022
Estimated Value: $189,909 - $333,000
Studio
--
Bath
--
Sq Ft
12,197
Sq Ft Lot
About This Home
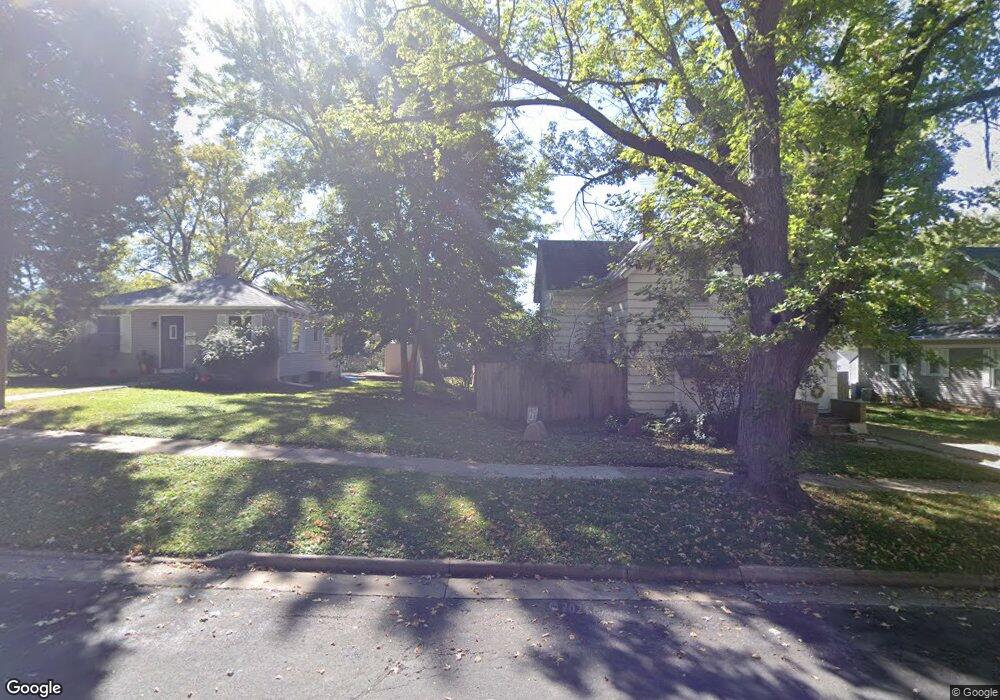
This home is located at 542 E Maple St, River Falls, WI 54022 and is currently estimated at $265,477. 542 E Maple St is a home located in Pierce County with nearby schools including Greenwood Elementary School, Meyer Middle School, and River Falls High School.
Ownership History
Date
Name
Owned For
Owner Type
Purchase Details
Closed on
Apr 22, 2016
Sold by
Westconsin Credit Union
Bought by
Felling James
Current Estimated Value
Purchase Details
Closed on
Feb 11, 2016
Sold by
Estate Of Kristine L Abrahamson and Abrahamson Kristine L
Bought by
Westconsin Credit Union
Purchase Details
Closed on
Jun 29, 2007
Sold by
Abrahamson Kristine L
Bought by
Revocabl Abrahamson Kristine L and Revocabl Kristine L Abrahamson
Create a Home Valuation Report for This Property
The Home Valuation Report is an in-depth analysis detailing your home's value as well as a comparison with similar homes in the area
Home Values in the Area
Average Home Value in this Area
Purchase History
| Date | Buyer | Sale Price | Title Company |
|---|---|---|---|
| Felling James | $68,000 | None Available | |
| Westconsin Credit Union | $53,939 | None Available | |
| Revocabl Abrahamson Kristine L | -- | None Available |
Source: Public Records
Tax History
| Year | Tax Paid | Tax Assessment Tax Assessment Total Assessment is a certain percentage of the fair market value that is determined by local assessors to be the total taxable value of land and additions on the property. | Land | Improvement |
|---|---|---|---|---|
| 2025 | $2,262 | $137,900 | $67,900 | $70,000 |
| 2024 | $2,651 | $125,600 | $51,900 | $73,700 |
| 2023 | $2,576 | $125,600 | $51,900 | $73,700 |
| 2022 | $2,208 | $125,600 | $51,900 | $73,700 |
| 2021 | $2,213 | $125,600 | $51,900 | $73,700 |
| 2020 | $2,201 | $90,100 | $41,500 | $48,600 |
| 2019 | $2,072 | $90,100 | $41,500 | $48,600 |
| 2018 | $2,069 | $90,100 | $41,500 | $48,600 |
| 2017 | $1,992 | $90,100 | $41,500 | $48,600 |
| 2016 | $1,910 | $90,100 | $41,500 | $48,600 |
| 2015 | $1,940 | $90,100 | $41,500 | $48,600 |
| 2014 | $2,025 | $107,200 | $44,600 | $62,600 |
| 2013 | $2,082 | $107,200 | $44,600 | $62,600 |
Source: Public Records
Map
Nearby Homes
- 101 S 8th St
- 103 S 6th St
- 522 E Walnut St
- 203 S 4th St
- 227 E Elm St
- 408 N 3rd St
- 216 E Elm St
- 1110 Wasson Cir
- 110 N Pearl St
- XXX N Troy
- XXX Troy St
- 404 S Winter St
- 115 S Dallas St
- 948 Hanson Dr
- 531 N Pearl St
- 700 Leroy Ln Unit 8
- 700 Leroy Ln Unit 47
- 1164 Bartosh Ln Unit 1
- 264 Gambel St
- 153 Gambel St
Your Personal Tour Guide
Ask me questions while you tour the home.