Estimated Value: $344,071 - $402,000
1
Bed
1
Bath
784
Sq Ft
$488/Sq Ft
Est. Value
About This Home
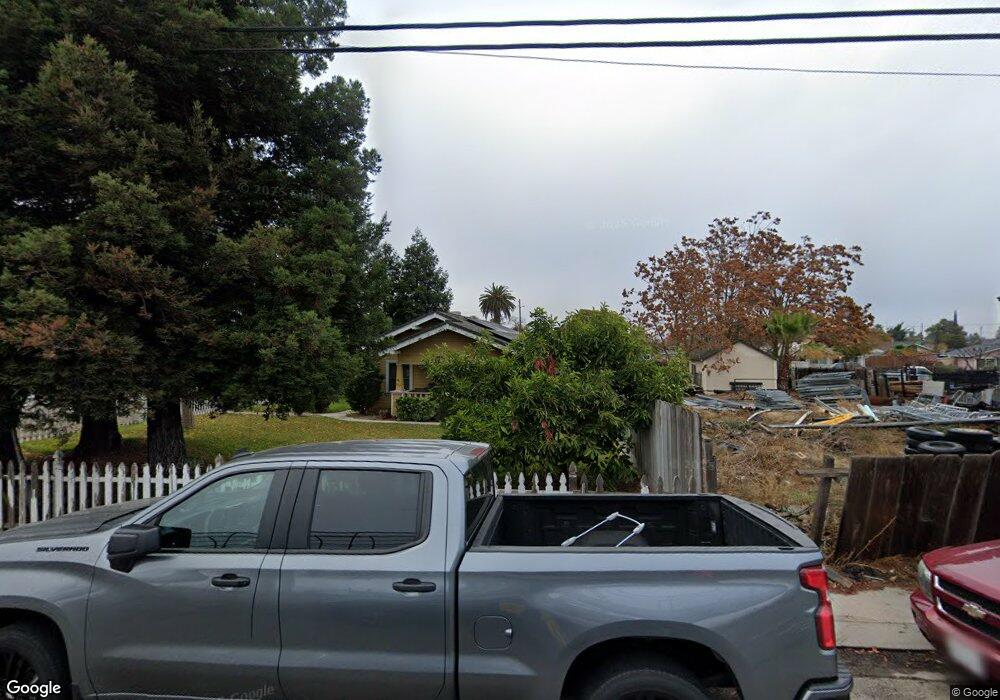
This home is located at 542 Frontage Rd, Ripon, CA 95366 and is currently estimated at $382,768, approximately $488 per square foot. 542 Frontage Rd is a home located in San Joaquin County with nearby schools including Ripona Elementary School, Park View Elementary School, and Ripon Elementary School.
Ownership History
Date
Name
Owned For
Owner Type
Purchase Details
Closed on
Jul 10, 2002
Sold by
Williams Juanita Bernice
Bought by
Villarreal Cipriano C
Current Estimated Value
Purchase Details
Closed on
Aug 16, 2001
Sold by
Williams Juanita Bernice and Estate Of James Orville Willia
Bought by
Villarreal Cipriano C
Home Financials for this Owner
Home Financials are based on the most recent Mortgage that was taken out on this home.
Original Mortgage
$134,000
Interest Rate
6.88%
Purchase Details
Closed on
Aug 15, 2001
Sold by
Williams James Alexander
Bought by
Williams Juanita Bernice
Home Financials for this Owner
Home Financials are based on the most recent Mortgage that was taken out on this home.
Original Mortgage
$134,000
Interest Rate
6.88%
Purchase Details
Closed on
Oct 20, 2000
Sold by
Williams Juanita Bernice and Williams James Orville
Bought by
Williams Juanita Bernice
Create a Home Valuation Report for This Property
The Home Valuation Report is an in-depth analysis detailing your home's value as well as a comparison with similar homes in the area
Home Values in the Area
Average Home Value in this Area
Purchase History
| Date | Buyer | Sale Price | Title Company |
|---|---|---|---|
| Villarreal Cipriano C | -- | Fidelity National Title Ins | |
| Williams Juanita Bernice | -- | Fidelity National Title Co | |
| Villarreal Cipriano C | $134,000 | Fidelity National Title Co | |
| Williams Juanita Bernice | -- | Fidelity National Title Co | |
| Williams Juanita Bernice | -- | -- |
Source: Public Records
Mortgage History
| Date | Status | Borrower | Loan Amount |
|---|---|---|---|
| Previous Owner | Villarreal Cipriano C | $134,000 |
Source: Public Records
Tax History
| Year | Tax Paid | Tax Assessment Tax Assessment Total Assessment is a certain percentage of the fair market value that is determined by local assessors to be the total taxable value of land and additions on the property. | Land | Improvement |
|---|---|---|---|---|
| 2025 | $2,113 | $197,940 | $59,085 | $138,855 |
| 2024 | $2,077 | $194,060 | $57,927 | $136,133 |
| 2023 | $2,034 | $190,256 | $56,792 | $133,464 |
| 2022 | $2,000 | $186,527 | $55,679 | $130,848 |
| 2021 | $1,968 | $182,871 | $54,588 | $128,283 |
| 2020 | $1,950 | $180,997 | $54,029 | $126,968 |
| 2019 | $1,916 | $177,449 | $52,970 | $124,479 |
| 2018 | $1,885 | $173,971 | $51,932 | $122,039 |
| 2017 | $1,848 | $170,561 | $50,914 | $119,647 |
| 2016 | $1,816 | $167,218 | $49,916 | $117,302 |
| 2014 | $1,031 | $94,600 | $28,600 | $66,000 |
Source: Public Records
Map
Nearby Homes
- 845 Sunrise Ave
- 410 Pine St
- 163 Franklin Ln
- 150 N Acacia Ave
- 244 California St
- 565 Bodeson Ct
- 205 3rd St
- 960 Goodwin Dr
- 547 Sepp Ct
- 788 E Milgeo Ave
- 749 Nancy Dr
- 663 Clay Way
- 183 Haller Ct
- 1537 Atlantic Ave
- 637 Rebekah Ct
- 138 Roxie Ct
- 346 S Manley Rd
- 243 John Kamps Way
- 0 Murphy Rd Unit 225148414
- 446 Meyenberg Ave
Your Personal Tour Guide
Ask me questions while you tour the home.