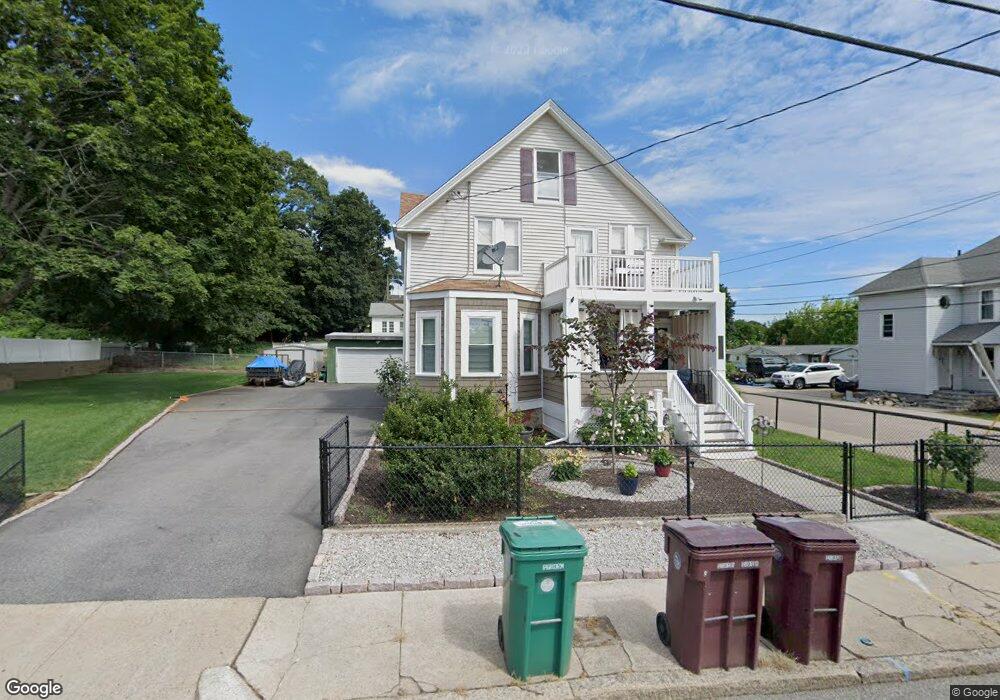
542 Gaskill St Woonsocket, RI 02895
Estimated Value: $338,406 - $482,000
4
Beds
2
Baths
1,745
Sq Ft
$223/Sq Ft
Est. Value
About This Home
This home is located at 542 Gaskill St, Woonsocket, RI 02895 and is currently estimated at $389,102, approximately $222 per square foot. 542 Gaskill St is a home located in Worcester County with nearby schools including Blackstone-Millville Regional High School, Rise Prep Mayoral Academy Middle School, and Rise Prep Mayoral Academy.
Ownership History
Date
Name
Owned For
Owner Type
Purchase Details
Closed on
Feb 23, 2022
Sold by
Leffland Annette A
Bought by
Lonchay Annette A
Current Estimated Value
Home Financials for this Owner
Home Financials are based on the most recent Mortgage that was taken out on this home.
Original Mortgage
$195,000
Outstanding Balance
$151,612
Interest Rate
2.77%
Mortgage Type
New Conventional
Estimated Equity
$237,490
Purchase Details
Closed on
Jan 28, 2022
Sold by
Leffland Annette A and Longchay Annette A
Bought by
Lonchay Annette A
Home Financials for this Owner
Home Financials are based on the most recent Mortgage that was taken out on this home.
Original Mortgage
$195,000
Outstanding Balance
$151,612
Interest Rate
2.77%
Mortgage Type
New Conventional
Estimated Equity
$237,490
Purchase Details
Closed on
Dec 16, 2002
Sold by
Hermance Robidoux F and Robidoux Hermance F
Bought by
Leffland Annette A
Home Financials for this Owner
Home Financials are based on the most recent Mortgage that was taken out on this home.
Original Mortgage
$177,625
Interest Rate
6.17%
Mortgage Type
Purchase Money Mortgage
Create a Home Valuation Report for This Property
The Home Valuation Report is an in-depth analysis detailing your home's value as well as a comparison with similar homes in the area
Home Values in the Area
Average Home Value in this Area
Purchase History
| Date | Buyer | Sale Price | Title Company |
|---|---|---|---|
| Lonchay Annette A | -- | None Available | |
| Lonchay Annette A | -- | None Available | |
| Lonchay Annette A | -- | None Available | |
| Lonchay Annette A | -- | None Available | |
| Leffland Annette A | $185,000 | -- | |
| Leffland Annette A | $185,000 | -- |
Source: Public Records
Mortgage History
| Date | Status | Borrower | Loan Amount |
|---|---|---|---|
| Open | Lonchay Annette A | $195,000 | |
| Closed | Lonchay Annette A | $195,000 | |
| Closed | Lonchay Annette A | $195,000 | |
| Previous Owner | Leffland Annette A | $177,625 |
Source: Public Records
Tax History
| Year | Tax Paid | Tax Assessment Tax Assessment Total Assessment is a certain percentage of the fair market value that is determined by local assessors to be the total taxable value of land and additions on the property. | Land | Improvement |
|---|---|---|---|---|
| 2025 | $2,560 | $228,000 | $57,500 | $170,500 |
| 2024 | $2,264 | $155,700 | $51,000 | $104,700 |
| 2023 | $2,177 | $155,700 | $51,000 | $104,700 |
| 2022 | $2,177 | $155,700 | $51,000 | $104,700 |
| 2021 | $1,741 | $73,300 | $31,800 | $41,500 |
| 2020 | $1,759 | $73,300 | $31,800 | $41,500 |
| 2018 | $1,765 | $73,300 | $31,800 | $41,500 |
| 2017 | $2,236 | $74,300 | $25,100 | $49,200 |
| 2016 | $2,366 | $74,300 | $25,100 | $49,200 |
| 2015 | $2,718 | $74,300 | $25,100 | $49,200 |
| 2014 | $2,634 | $73,300 | $27,600 | $45,700 |
Source: Public Records
Map
Nearby Homes
- 542 Prospect St
- 458 Prospect St
- 154 156 Winter St
- 83 Summer St
- 130 E School St
- 60 Fairlawn Ave
- 56 Winter St
- 10 Huntington Ave
- 44 Federal St
- 256 Privilege St
- 11 Federal St
- 308 Harris Ave
- 58 Oakley Rd
- 40 Valley St
- 0 N Main St Unit 1401765
- 42 Elbow St
- 115 Railroad St
- 22 Fox Run Rd
- 13 Ethel St
- 752 Social St
Your Personal Tour Guide
Ask me questions while you tour the home.