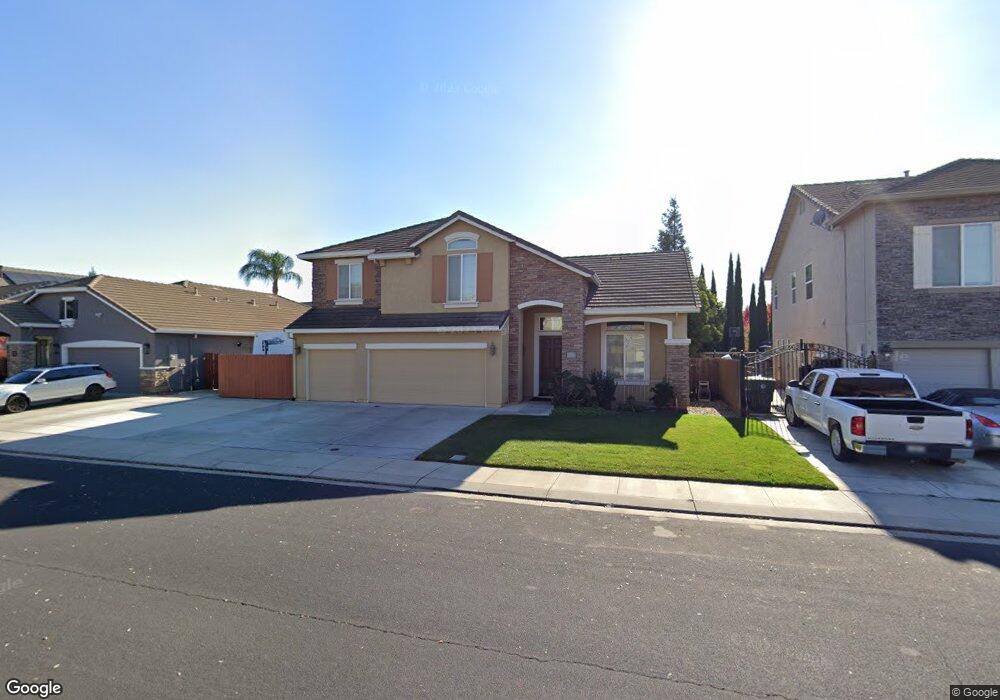
542 Grafton St Manteca, CA 95337
Estimated Value: $671,000 - $785,000
4
Beds
3
Baths
2,755
Sq Ft
$268/Sq Ft
Est. Value
About This Home
This home is located at 542 Grafton St, Manteca, CA 95337 and is currently estimated at $738,759, approximately $268 per square foot. 542 Grafton St is a home located in San Joaquin County with nearby schools including Walter Woodward Elementary School and Manteca High School.
Ownership History
Date
Name
Owned For
Owner Type
Purchase Details
Closed on
Apr 3, 2017
Sold by
Landeros Alex V
Bought by
Landeros Alex V and Alex V Landeros Sr Living Trus
Current Estimated Value
Purchase Details
Closed on
Sep 11, 2012
Sold by
Landeros Ursula M and Landeros Alex V
Bought by
Landeros Alex V
Home Financials for this Owner
Home Financials are based on the most recent Mortgage that was taken out on this home.
Original Mortgage
$282,700
Outstanding Balance
$195,801
Interest Rate
3.59%
Mortgage Type
New Conventional
Estimated Equity
$542,958
Purchase Details
Closed on
Jan 3, 2008
Sold by
Anderson Homes
Bought by
Landeros Alex V and Landeros Ursula M
Home Financials for this Owner
Home Financials are based on the most recent Mortgage that was taken out on this home.
Original Mortgage
$288,000
Interest Rate
6.49%
Mortgage Type
Purchase Money Mortgage
Create a Home Valuation Report for This Property
The Home Valuation Report is an in-depth analysis detailing your home's value as well as a comparison with similar homes in the area
Home Values in the Area
Average Home Value in this Area
Purchase History
| Date | Buyer | Sale Price | Title Company |
|---|---|---|---|
| Landeros Alex V | -- | None Available | |
| Landeros Alex V | -- | None Available | |
| Landeros Alex V | $360,000 | Chicago Title Company |
Source: Public Records
Mortgage History
| Date | Status | Borrower | Loan Amount |
|---|---|---|---|
| Open | Landeros Alex V | $282,700 | |
| Previous Owner | Landeros Alex V | $288,000 |
Source: Public Records
Tax History Compared to Growth
Tax History
| Year | Tax Paid | Tax Assessment Tax Assessment Total Assessment is a certain percentage of the fair market value that is determined by local assessors to be the total taxable value of land and additions on the property. | Land | Improvement |
|---|---|---|---|---|
| 2025 | $6,592 | $476,476 | $139,068 | $337,408 |
| 2024 | $6,443 | $467,135 | $136,342 | $330,793 |
| 2023 | $6,380 | $457,976 | $133,669 | $324,307 |
| 2022 | $6,304 | $448,998 | $131,049 | $317,949 |
| 2021 | $6,249 | $440,195 | $128,480 | $311,715 |
| 2020 | $6,039 | $435,682 | $127,163 | $308,519 |
| 2019 | $5,965 | $427,140 | $124,670 | $302,470 |
| 2018 | $5,881 | $418,766 | $122,226 | $296,540 |
| 2017 | $5,774 | $410,556 | $119,830 | $290,726 |
| 2016 | $5,677 | $402,508 | $117,481 | $285,027 |
| 2014 | $5,279 | $388,703 | $113,452 | $275,251 |
Source: Public Records
Map
Nearby Homes
- 576 Catmint St
- 443 Catmint St Unit 1
- 1749 Queensland Ave
- 1471 Tanoak St
- 772 Wynyard Cir
- 1813 Santa Ana Place
- 963 Grafton St
- 948 Monarch Ct
- 215 Generations Ct
- 984 E Woodward Ave
- 1773 Lana Way
- 769 Dody Dr
- 1471 Bosco Ln
- 864 Heartland Dr
- 1076 Balzo St
- 1455 Orgullo Ln
- 1175 Miel St
- 2446 Paramount Ln
- 597 Pendragon St
- 1734 Bandoni Ln
- 554 Grafton St
- 530 Grafton St
- 539 Catmint St
- 551 Catmint St
- 566 Grafton St
- 1708 Buena Vista Dr
- 1718 Buena Vista Dr
- 545 Grafton St
- 563 Catmint St
- 537 Grafton St
- 578 Grafton St
- 525 Grafton St
- 569 Grafton St
- 575 Catmint St
- 513 Grafton St
- 592 Grafton St
- 552 Catmint St
- 577 Grafton St
- 468 Grafton St
- 587 Catmint St