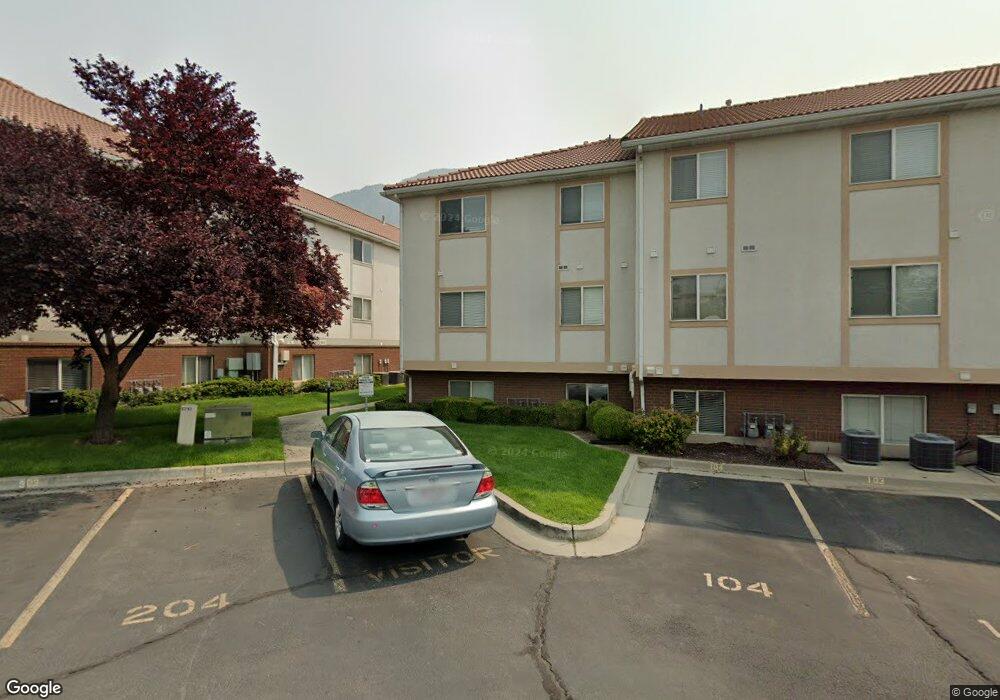
542 N 720 E Provo, UT 84606
Joaquin NeighborhoodEstimated Value: $335,000 - $348,000
2
Beds
1
Bath
872
Sq Ft
$391/Sq Ft
Est. Value
About This Home
This home is located at 542 N 720 E, Provo, UT 84606 and is currently estimated at $340,542, approximately $390 per square foot. 542 N 720 E is a home located in Utah County with nearby schools including Provo Peaks School, Centennial Middle School, and Timpview High School.
Ownership History
Date
Name
Owned For
Owner Type
Purchase Details
Closed on
Jul 7, 2022
Sold by
Barber Sharlene T
Bought by
Cruze Lori B
Current Estimated Value
Purchase Details
Closed on
Sep 20, 2002
Sold by
Favero P Aaron and Favero Brooke
Bought by
Barber Russell B and Barber Sharlene T
Home Financials for this Owner
Home Financials are based on the most recent Mortgage that was taken out on this home.
Original Mortgage
$114,800
Interest Rate
6.16%
Purchase Details
Closed on
Feb 26, 2000
Sold by
Favero Brooke and Aaron Favero P
Bought by
Favero P Aaron and Favero Brooke
Home Financials for this Owner
Home Financials are based on the most recent Mortgage that was taken out on this home.
Original Mortgage
$93,000
Interest Rate
6.98%
Purchase Details
Closed on
Sep 18, 1997
Sold by
Griffin Brent L and Lorscheider Michael H
Bought by
Favero Brooke and Aaron Favero P
Home Financials for this Owner
Home Financials are based on the most recent Mortgage that was taken out on this home.
Original Mortgage
$95,850
Interest Rate
7.54%
Mortgage Type
FHA
Create a Home Valuation Report for This Property
The Home Valuation Report is an in-depth analysis detailing your home's value as well as a comparison with similar homes in the area
Home Values in the Area
Average Home Value in this Area
Purchase History
| Date | Buyer | Sale Price | Title Company |
|---|---|---|---|
| Cruze Lori B | -- | None Listed On Document | |
| Barber Russell B | -- | Mountain West Title Co | |
| Favero P Aaron | -- | Mountain West Title Co | |
| Favero Brooke | -- | -- |
Source: Public Records
Mortgage History
| Date | Status | Borrower | Loan Amount |
|---|---|---|---|
| Previous Owner | Barber Russell B | $114,800 | |
| Previous Owner | Favero P Aaron | $93,000 | |
| Previous Owner | Favero Brooke | $95,850 |
Source: Public Records
Tax History
| Year | Tax Paid | Tax Assessment Tax Assessment Total Assessment is a certain percentage of the fair market value that is determined by local assessors to be the total taxable value of land and additions on the property. | Land | Improvement |
|---|---|---|---|---|
| 2025 | $1,745 | $178,640 | -- | -- |
| 2024 | $1,745 | $171,765 | $0 | $0 |
| 2023 | $1,730 | $167,860 | $0 | $0 |
| 2022 | $1,621 | $158,620 | $0 | $0 |
| 2021 | $1,363 | $232,600 | $27,900 | $204,700 |
| 2020 | $1,345 | $215,100 | $25,800 | $189,300 |
| 2019 | $1,170 | $194,700 | $23,400 | $171,300 |
| 2018 | $1,154 | $194,700 | $23,400 | $171,300 |
| 2017 | $1,039 | $96,360 | $0 | $0 |
| 2016 | $1,032 | $89,210 | $0 | $0 |
| 2015 | $982 | $85,800 | $0 | $0 |
| 2014 | $910 | $82,830 | $0 | $0 |
Source: Public Records
Map
Nearby Homes
- 785 E 560 N Unit 405
- 362 N 800 E
- 541 E 500 N Unit 12
- 737 E 750 N Unit 1
- 386 N 500 E
- 364 N 500 E
- 240 N 500 East St
- 864 E 200 N
- 907 E 820 N Unit 11
- 1051 E 300 N
- 394 N 300 E
- 433 N 300 E
- 532 N Seven Peaks Blvd Unit 302
- 466 N 200 E
- 232 E 400 N
- 380 N 200 E
- 232 E 300 N
- 246 N 200 E
- 136 E 400 N Unit 108
- 136 E 400 N Unit 107
- 542 N 720 E
- 542 N 720 E
- 542 N 720 E Unit 118
- 529 N 790 E
- 529 N 790 E
- 529 N 790 E Unit 210
- 529 N 790 E
- 529 N 790 E Unit 110
- 529 N 790 E
- 529 N 790 E Unit 311
- 529 N 790 E Unit 111
- 529 N 790 E Unit 211
- 766 E 560 N
- 766 E 560 N
- 766 E 560 N
- 766 E 560 N
- 766 E 560 N
- 766 E 560 N
- 766 E 560 N Unit 105
- 766 E 560 N Unit 306
Your Personal Tour Guide
Ask me questions while you tour the home.