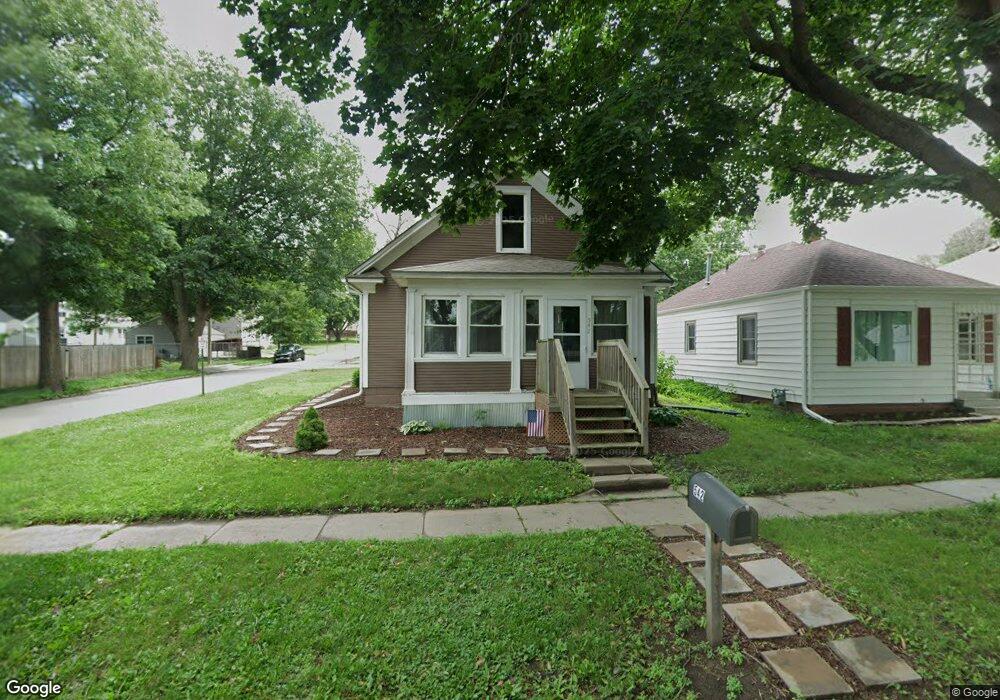
542 N 8th St Seward, NE 68434
Estimated Value: $178,000 - $226,000
3
Beds
1
Bath
1,296
Sq Ft
$153/Sq Ft
Est. Value
About This Home
This home is located at 542 N 8th St, Seward, NE 68434 and is currently estimated at $197,702, approximately $152 per square foot. 542 N 8th St is a home located in Seward County with nearby schools including Seward Elementary School, Seward Middle School, and Seward High School.
Ownership History
Date
Name
Owned For
Owner Type
Purchase Details
Closed on
Jun 28, 2022
Sold by
Weatherly Kimberly A
Bought by
Nitz Scott P and Nitz Shelly J
Current Estimated Value
Purchase Details
Closed on
Oct 24, 2017
Sold by
Kats Investments Llc
Bought by
Weatherly Kimberly A
Home Financials for this Owner
Home Financials are based on the most recent Mortgage that was taken out on this home.
Original Mortgage
$114,141
Interest Rate
3.83%
Mortgage Type
New Conventional
Purchase Details
Closed on
Jul 14, 2017
Sold by
Playful Cat Properties Llc
Bought by
Kats Investments Llc
Home Financials for this Owner
Home Financials are based on the most recent Mortgage that was taken out on this home.
Original Mortgage
$50,000
Interest Rate
3.89%
Mortgage Type
Construction
Create a Home Valuation Report for This Property
The Home Valuation Report is an in-depth analysis detailing your home's value as well as a comparison with similar homes in the area
Home Values in the Area
Average Home Value in this Area
Purchase History
| Date | Buyer | Sale Price | Title Company |
|---|---|---|---|
| Nitz Scott P | $157,000 | Home Services Title | |
| Weatherly Kimberly A | $113,000 | Charter Title & Escrow Servi | |
| Kats Investments Llc | $50,000 | Charter Title & Escrow Servi |
Source: Public Records
Mortgage History
| Date | Status | Borrower | Loan Amount |
|---|---|---|---|
| Previous Owner | Weatherly Kimberly A | $114,141 | |
| Previous Owner | Kats Investments Llc | $50,000 |
Source: Public Records
Tax History Compared to Growth
Tax History
| Year | Tax Paid | Tax Assessment Tax Assessment Total Assessment is a certain percentage of the fair market value that is determined by local assessors to be the total taxable value of land and additions on the property. | Land | Improvement |
|---|---|---|---|---|
| 2024 | $1,597 | $139,748 | $14,177 | $125,571 |
| 2023 | $1,851 | $127,304 | $14,177 | $113,127 |
| 2022 | $1,834 | $113,943 | $14,177 | $99,766 |
| 2021 | $1,680 | $103,254 | $14,177 | $89,077 |
| 2020 | $1,701 | $103,254 | $14,177 | $89,077 |
| 2019 | $1,462 | $89,704 | $14,135 | $75,569 |
| 2018 | $1,398 | $86,697 | $13,134 | $73,563 |
| 2017 | $1,361 | $55,680 | $12,509 | $43,171 |
| 2016 | $1,187 | $73,138 | $12,509 | $60,629 |
| 2015 | $1,206 | $73,138 | $12,509 | $60,629 |
| 2013 | $1,364 | $73,580 | $7,820 | $65,760 |
Source: Public Records
Map
Nearby Homes