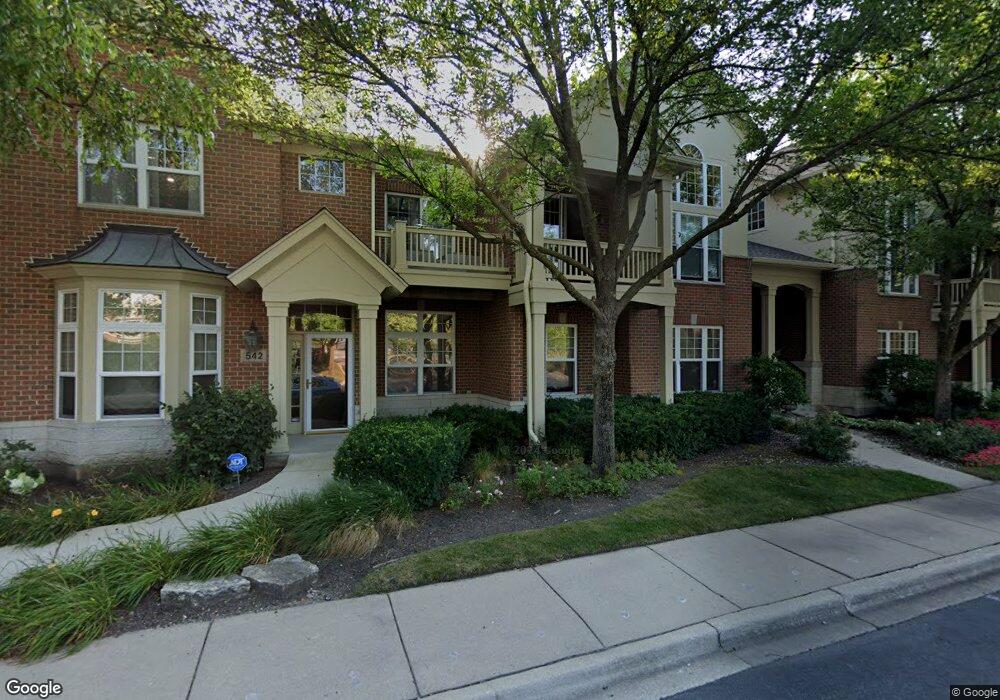
542 S Commons Ct Unit 201-005 Deerfield, IL 60015
Estimated Value: $461,277 - $515,000
2
Beds
2
Baths
1,632
Sq Ft
$299/Sq Ft
Est. Value
About This Home
This home is located at 542 S Commons Ct Unit 201-005, Deerfield, IL 60015 and is currently estimated at $487,319, approximately $298 per square foot. 542 S Commons Ct Unit 201-005 is a home located in Lake County with nearby schools including South Park Elementary School, Charles J Caruso Middle School, and Deerfield High School.
Ownership History
Date
Name
Owned For
Owner Type
Purchase Details
Closed on
Nov 18, 2020
Sold by
Meyers Marie and Frigo Teresa
Bought by
Frimi Alalu Trust
Current Estimated Value
Purchase Details
Closed on
Mar 25, 2015
Sold by
Rathslag Mary
Bought by
Rathslag Mary and Trust Of Mary Rathslag
Purchase Details
Closed on
Dec 9, 2006
Sold by
Morris Kathleen Ann Walsh
Bought by
Rathslag Mary
Purchase Details
Closed on
Jul 13, 2004
Sold by
Morris Kathleen Ann Walsh
Bought by
Decl Morris Kathleen Ann Walsh and Kathleen Ann Walsh Morris Declaration Of
Purchase Details
Closed on
Oct 19, 2001
Sold by
Morris Kathleen Ann Walsh
Bought by
Walsh Morris Robert J and Walsh Morris Kathleen Ann
Purchase Details
Closed on
Apr 10, 2001
Sold by
Morris Robert J and Morris Kathleen
Bought by
Morris Robert J and Walsh Kathleen Ann
Purchase Details
Closed on
Nov 3, 2000
Sold by
South Commons Venture
Bought by
Morris Robert J and Morris Kathleen W
Create a Home Valuation Report for This Property
The Home Valuation Report is an in-depth analysis detailing your home's value as well as a comparison with similar homes in the area
Home Values in the Area
Average Home Value in this Area
Purchase History
| Date | Buyer | Sale Price | Title Company |
|---|---|---|---|
| Frimi Alalu Trust | -- | Chicago Title | |
| Rathslag Mary | -- | None Available | |
| Rathslag Mary | $420,000 | None Available | |
| Decl Morris Kathleen Ann Walsh | -- | -- | |
| Walsh Morris Robert J | -- | Lawyers Title | |
| Walsh Morris Robert J | -- | Lawyers Title | |
| Morris Robert J | -- | -- | |
| Morris Robert J | $354,000 | -- |
Source: Public Records
Tax History Compared to Growth
Tax History
| Year | Tax Paid | Tax Assessment Tax Assessment Total Assessment is a certain percentage of the fair market value that is determined by local assessors to be the total taxable value of land and additions on the property. | Land | Improvement |
|---|---|---|---|---|
| 2024 | $10,636 | $126,125 | $15,008 | $111,117 |
| 2023 | $11,059 | $121,041 | $14,403 | $106,638 |
| 2022 | $11,059 | $122,751 | $13,542 | $109,209 |
| 2021 | $10,426 | $118,348 | $13,056 | $105,292 |
| 2020 | $9,582 | $118,597 | $13,083 | $105,514 |
| 2019 | $9,370 | $118,396 | $13,061 | $105,335 |
| 2018 | $8,891 | $117,280 | $13,844 | $103,436 |
| 2017 | $8,819 | $116,906 | $13,800 | $103,106 |
| 2016 | $8,553 | $112,485 | $13,278 | $99,207 |
| 2015 | $8,341 | $105,689 | $12,476 | $93,213 |
| 2014 | $8,076 | $101,438 | $12,564 | $88,874 |
| 2012 | $7,989 | $100,543 | $12,453 | $88,090 |
Source: Public Records
Map
Nearby Homes
- 610 Robert York Ave Unit 104
- 441 Elm St Unit 3A
- 679 Central Ave
- 956 Brookside Ln
- 630 Hermitage Dr
- 1009 Central Ave
- 372 Kelburn Rd Unit 313
- 382 Kelburn Rd Unit 122
- 1038 Brookside Ln
- 361 Kelburn Rd Unit 316
- 745 Price Ln
- 757 Kipling Place
- 904 Forest Ave
- 312 Pine St
- 860 Kenton Rd
- 505 Margate Terrace
- 1103 Hazel Ave
- 677 Timber Hill Rd
- 934 Wayne Ave
- 717 Brierhill Rd
- 542 S Commons Ct Unit S
- 544 S Commons Ct Unit 201-004
- 540 S Commons Ct
- 540 S Commons Ct Unit 540
- 540 S Commons Ct Unit S
- 546 S Commons Ct Unit CT20100
- 548 S Commons Ct Unit 201-002
- 550 S Commons Ct
- 550 S Commons Ct Unit 490
- 550 S Commons Ct Unit 550
- 530 S Commons Ct Unit S
- 528 S Commons Ct Unit S
- 526 S Commons Ct Unit S
- 520 S Commons Ct Unit 202012
- 522 S Commons Ct Unit 202011
- 524 S Commons Ct Unit 202010
- 520 S Commons Ct Unit 202-01
- 520 S Commons Ct
- 535 S Commons Ct Unit S
- 533 S Commons Ct Unit S