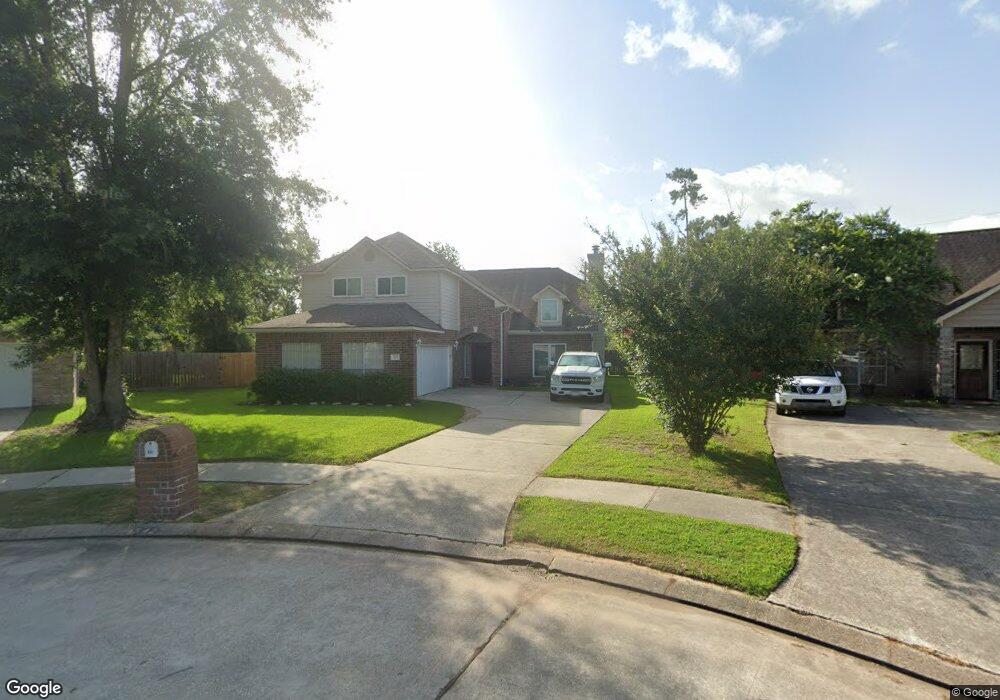
542 Starkstone Ct Spring, TX 77386
Estimated Value: $364,000 - $398,360
5
Beds
4
Baths
2,872
Sq Ft
$134/Sq Ft
Est. Value
About This Home
This home is located at 542 Starkstone Ct, Spring, TX 77386 and is currently estimated at $384,840, approximately $133 per square foot. 542 Starkstone Ct is a home located in Montgomery County with nearby schools including Oak Ridge Elementary School, Vogel Intermediate School, and Irons J High School.
Ownership History
Date
Name
Owned For
Owner Type
Purchase Details
Closed on
Jul 1, 2016
Sold by
Browning Cammie and Danko Melanie Camille
Bought by
Madison Keith and Madison Linda
Current Estimated Value
Home Financials for this Owner
Home Financials are based on the most recent Mortgage that was taken out on this home.
Original Mortgage
$68,303
Outstanding Balance
$30,975
Interest Rate
3.58%
Mortgage Type
New Conventional
Estimated Equity
$353,865
Purchase Details
Closed on
Nov 1, 2000
Sold by
Terra Firma Development Corp
Bought by
Danko Melanie
Home Financials for this Owner
Home Financials are based on the most recent Mortgage that was taken out on this home.
Original Mortgage
$142,792
Interest Rate
7.87%
Mortgage Type
FHA
Purchase Details
Closed on
Jan 25, 2000
Sold by
Oakridge Associates
Bought by
Madison Keith and Madison Linda
Create a Home Valuation Report for This Property
The Home Valuation Report is an in-depth analysis detailing your home's value as well as a comparison with similar homes in the area
Home Values in the Area
Average Home Value in this Area
Purchase History
| Date | Buyer | Sale Price | Title Company |
|---|---|---|---|
| Madison Keith | -- | Texas Homeland Title | |
| Danko Melanie | -- | -- | |
| Madison Keith | -- | -- |
Source: Public Records
Mortgage History
| Date | Status | Borrower | Loan Amount |
|---|---|---|---|
| Open | Madison Keith | $68,303 | |
| Previous Owner | Danko Melanie | $142,792 |
Source: Public Records
Tax History Compared to Growth
Tax History
| Year | Tax Paid | Tax Assessment Tax Assessment Total Assessment is a certain percentage of the fair market value that is determined by local assessors to be the total taxable value of land and additions on the property. | Land | Improvement |
|---|---|---|---|---|
| 2025 | $2,886 | $366,310 | $58,000 | $308,310 |
| 2024 | $2,841 | $345,532 | -- | -- |
| 2023 | $2,841 | $314,120 | $58,000 | $279,000 |
| 2022 | $5,771 | $285,560 | $58,000 | $258,860 |
| 2021 | $5,578 | $259,600 | $12,100 | $265,970 |
| 2020 | $5,771 | $257,140 | $12,100 | $245,040 |
| 2019 | $5,539 | $254,740 | $12,100 | $242,640 |
| 2018 | $4,713 | $235,520 | $12,100 | $223,420 |
| 2017 | $5,529 | $235,520 | $12,100 | $223,420 |
| 2016 | $4,565 | $194,470 | $12,100 | $182,370 |
| 2015 | $3,920 | $189,290 | $12,100 | $187,180 |
| 2014 | $3,920 | $172,080 | $12,100 | $159,980 |
Source: Public Records
Map
Nearby Homes
- 25619 Oakridge Forest Ln
- 427 Pinewood Ridge Dr
- 25807 Oakridge Forest Ln
- 25819 Oakridge Forest Ln
- 323 Spring Woods Dr
- 519 Joshua Lee Ln
- 25142 Andris Ln
- 25802 Maplewood Dr
- 25206 #5 Spring Ridge Dr
- 25131 Alina Ln
- 25535 Richards Rd
- 25206 Spring Ridge Dr
- 1010 Forestburg Dr
- 26003 Woodglen Dr
- 26107 Maplewood Dr
- 119 Heatherwood Dr
- 31003 N Head Dr
- 0 Sagewood
- 1407 Buchans Dr
- 1306 Caraquet Dr
- 538 Starkstone Ct
- 543 Starkstone Ct
- 534 Starkstone Ct
- 539 Starkstone Ct
- 530 Starkstone Ct
- 527 Glenwood Ridge Dr
- 535 Starkstone Ct
- 531 Starkstone Ct
- 523 Glenwood Ridge Dr
- 526 Starkstone Ct
- 502 Hearthstone Ct
- 506 Hearthstone Ct
- 527 Starkstone Ct
- 503 Hearthstone Ct
- 519 Glenwood Ridge Dr
- 522 Starkstone Ct
- 25706 Bearborough Dr
- 515 Glenwood Ridge Dr
- 507 Hearthstone Ct
- 526 Glenwood Ridge Dr