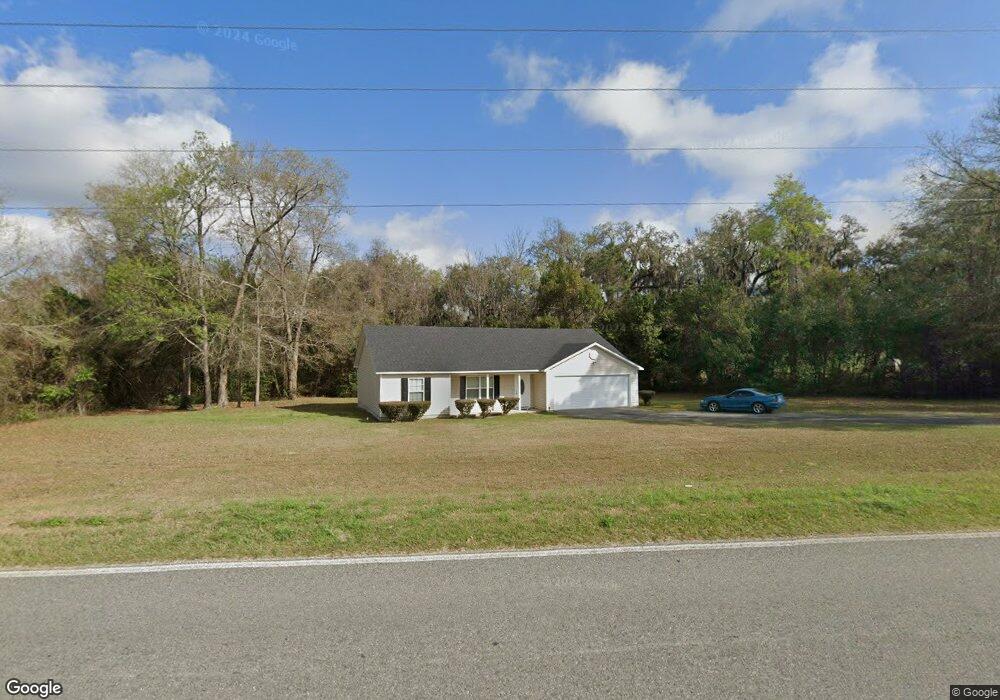
5420 Clyattville Nankin Rd Valdosta, GA 31601
Estimated Value: $176,000 - $204,000
3
Beds
2
Baths
1,519
Sq Ft
$129/Sq Ft
Est. Value
About This Home
This home is located at 5420 Clyattville Nankin Rd, Valdosta, GA 31601 and is currently estimated at $196,043, approximately $129 per square foot. 5420 Clyattville Nankin Rd is a home located in Lowndes County with nearby schools including Clyattville Elementary School, Lowndes Middle School, and Lowndes High School.
Ownership History
Date
Name
Owned For
Owner Type
Purchase Details
Closed on
Apr 23, 2014
Sold by
Sec Of Housing & U
Bought by
West Ralph Jason
Current Estimated Value
Home Financials for this Owner
Home Financials are based on the most recent Mortgage that was taken out on this home.
Original Mortgage
$83,587
Outstanding Balance
$62,398
Interest Rate
3.87%
Mortgage Type
FHA
Estimated Equity
$133,645
Purchase Details
Closed on
Sep 25, 2013
Sold by
Bank Of America Na
Bought by
Secretary Of Housing And Urban
Purchase Details
Closed on
Sep 3, 2013
Sold by
Bank Of America
Bought by
Sec Of Housing & Urban
Purchase Details
Closed on
Aug 21, 2008
Sold by
Garrett Jonathan
Bought by
Finney Jerry A
Home Financials for this Owner
Home Financials are based on the most recent Mortgage that was taken out on this home.
Original Mortgage
$113,050
Interest Rate
6.61%
Mortgage Type
FHA
Purchase Details
Closed on
Apr 16, 2001
Bought by
Garrett Jonathan B and Garrett Jennifer C
Create a Home Valuation Report for This Property
The Home Valuation Report is an in-depth analysis detailing your home's value as well as a comparison with similar homes in the area
Home Values in the Area
Average Home Value in this Area
Purchase History
| Date | Buyer | Sale Price | Title Company |
|---|---|---|---|
| West Ralph Jason | $81,700 | -- | |
| Secretary Of Housing And Urban | $89,300 | -- | |
| Sec Of Housing & Urban | $89,310 | -- | |
| Bank Of America | $89,310 | -- | |
| Finney Jerry A | $114,825 | -- | |
| Garrett Jonathan B | -- | -- |
Source: Public Records
Mortgage History
| Date | Status | Borrower | Loan Amount |
|---|---|---|---|
| Open | West Ralph Jason | $83,587 | |
| Previous Owner | Finney Jerry A | $113,050 |
Source: Public Records
Tax History Compared to Growth
Tax History
| Year | Tax Paid | Tax Assessment Tax Assessment Total Assessment is a certain percentage of the fair market value that is determined by local assessors to be the total taxable value of land and additions on the property. | Land | Improvement |
|---|---|---|---|---|
| 2024 | $1,026 | $49,012 | $2,989 | $46,023 |
| 2023 | $1,026 | $48,817 | $2,794 | $46,023 |
| 2022 | $817 | $35,314 | $2,794 | $32,520 |
| 2021 | $854 | $35,314 | $2,794 | $32,520 |
| 2020 | $792 | $35,293 | $2,773 | $32,520 |
| 2019 | $800 | $35,293 | $2,773 | $32,520 |
| 2018 | $862 | $37,222 | $4,382 | $32,840 |
| 2017 | $876 | $37,222 | $4,382 | $32,840 |
| 2016 | $878 | $37,222 | $4,382 | $32,840 |
| 2015 | $719 | $37,222 | $4,382 | $32,840 |
| 2014 | $980 | $35,638 | $2,798 | $32,840 |
Source: Public Records
Map
Nearby Homes
- 5450 Clyattville-Nankin Rd
- 5445 Camellia Dr S
- 5213 Pine St
- 5306 Madison Hwy
- 5013 Cedar St
- 0 Johnson Rd S Unit 10484663
- . Johnson Rd S
- 4353 1st St S
- 4165 Johnson Rd S
- 4642 Quarterman Estates Dr
- 4545 Brice Bend Dr
- Lot 9 Davis Rd SW
- Lot 8 Davis Rd SW
- Lot 10 Davis Rd SW
- Lot 7 Davis Rd SW
- 4200 Beaver Run Rd
- 1044 Mary Nell
- 4466 White Water Rd
- 4122 Quail Nest Dr
- 1012 Mary Nell Crt
- 5313 Clyattvlle Lk Pk Rd Unit MAIN
- Lot 13 Pine St
- Lot 14 Pine St
- 5450 Clyattville Nankin Rd
- 5311 Cherry St
- 5315 Cherry St
- 5311 Main St
- 5444 Camellia Dr S
- 4435 Old Clyattville Rd
- .44 W Cherry St
- 5440 Camellia Dr S
- 5215 Pine St
- 5307 Main St
- 5436 Camellia Dr S
- 5218 Pine St
- 5305 Main St
- 5441 Camellia Dr S
- 5303 Cherry St
- 5306 Cherry St
- 5119 Walnut St