
Seller's Agent in 2024
Brad Plocek
Key Realty
(419) 320-2129
4 in this area
113 Total Sales


Estimated Value: $107,000 - $122,000
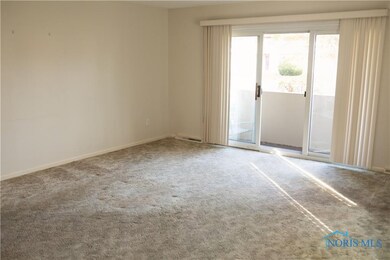
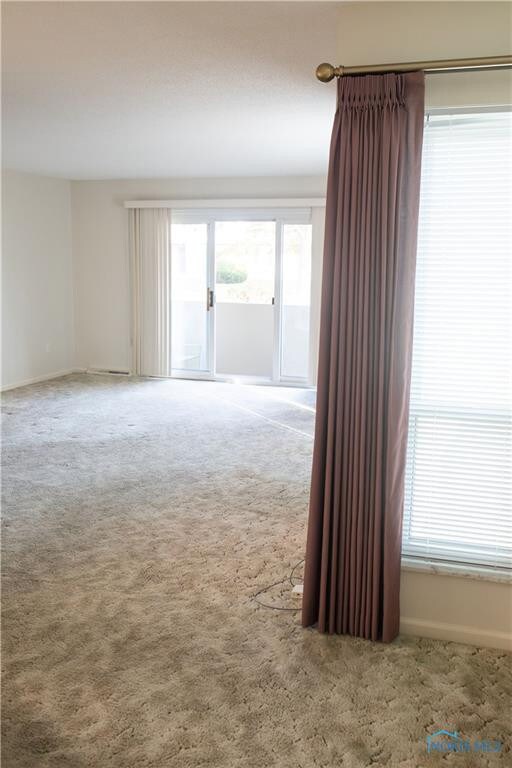
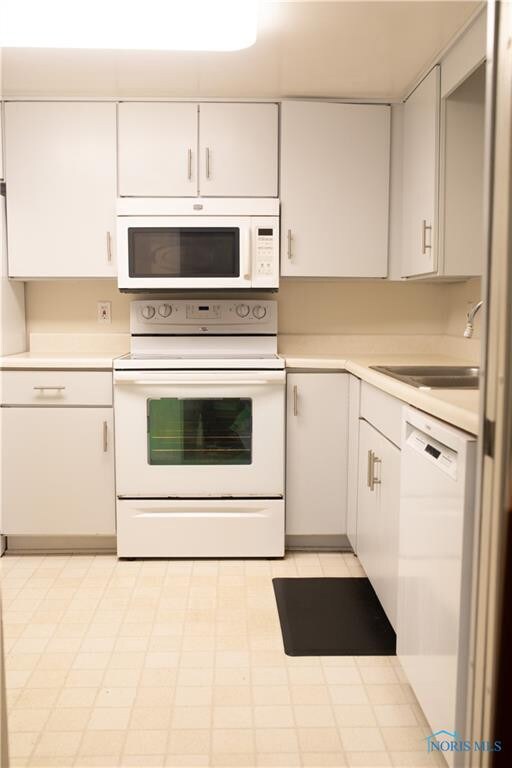
Welcome home to this spacious South Toledo condo featuring two full bathrooms, including a private primary bath/suite for added convenience. Large living room w/ slider leading to private patio. Unit features updated windows, new drapes and blinds, and updated mechanicals. All appliances are included, and with a low HOA fee and possession at closing, this condo offers both value and comfort in an ideal location. Conveniently located near shopping, highways, and numerous metro parks. Don’t miss the chance to make it yours—priced to sell!
| Date | Buyer | Sale Price | Title Company |
|---|---|---|---|
| Sickles Jo Ann | -- | None Available | |
| Sickles Geoffrey M | -- | -- | |
| Wolff Jo Ann | $67,000 | -- | |
| -- | -- | -- |
| Date | Status | Borrower | Loan Amount |
|---|---|---|---|
| Open | Sickles Geoffrey M | $71,000 | |
| Closed | Wolff Jo Ann | $53,600 |
| Date | Event | Price | List to Sale | Price per Sq Ft | Prior Sale |
|---|---|---|---|---|---|
| 12/18/2024 12/18/24 | Sold | $82,000 | +9.5% | $63 / Sq Ft | |
| 12/16/2024 12/16/24 | Pending | -- | -- | -- | |
| 11/09/2024 11/09/24 | For Sale | $74,900 | +24.8% | $57 / Sq Ft | |
| 04/17/2018 04/17/18 | Sold | $60,000 | -7.6% | $46 / Sq Ft | View Prior Sale |
| 03/15/2018 03/15/18 | Pending | -- | -- | -- | |
| 03/09/2018 03/09/18 | For Sale | $64,900 | +18.0% | $50 / Sq Ft | |
| 09/15/2017 09/15/17 | Sold | $55,000 | -8.2% | $42 / Sq Ft | View Prior Sale |
| 09/01/2017 09/01/17 | Pending | -- | -- | -- | |
| 07/13/2017 07/13/17 | Price Changed | $59,900 | -6.4% | $46 / Sq Ft | |
| 06/30/2017 06/30/17 | For Sale | $64,000 | -- | $49 / Sq Ft |
| Year | Tax Paid | Tax Assessment Tax Assessment Total Assessment is a certain percentage of the fair market value that is determined by local assessors to be the total taxable value of land and additions on the property. | Land | Improvement |
|---|---|---|---|---|
| 2024 | $810 | $36,505 | $5,320 | $31,185 |
| 2023 | $996 | $24,395 | $4,200 | $20,195 |
| 2022 | $1,018 | $24,395 | $4,200 | $20,195 |
| 2021 | $1,041 | $24,395 | $4,200 | $20,195 |
| 2020 | $1,133 | $23,905 | $2,905 | $21,000 |
| 2019 | $1,106 | $23,905 | $2,905 | $21,000 |
| 2018 | $1,106 | $23,905 | $2,905 | $21,000 |
| 2017 | $1,121 | $23,345 | $2,835 | $20,510 |
| 2016 | $1,116 | $66,700 | $8,100 | $58,600 |
| 2015 | $1,105 | $66,700 | $8,100 | $58,600 |
| 2014 | $918 | $23,350 | $2,840 | $20,510 |
| 2013 | $918 | $23,350 | $2,840 | $20,510 |
Seller's Agent in 2024
Brad Plocek
Key Realty
(419) 320-2129
4 in this area
113 Total Sales
M
Buyer's Agent in 2024
Monica Craig
Howard Hanna
(419) 450-8195
3 in this area
12 Total Sales
Seller's Agent in 2018
Patrick Leahy
RE/MAX
(419) 283-8001
80 Total Sales
Buyer's Agent in 2018
Donald Boring
RE/MAX
(419) 277-2470
16 Total Sales
A
Seller's Agent in 2017
Anne Jackson-Fowler
The Danberry Co
Source: Northwest Ohio Real Estate Information Service (NORIS)
MLS Number: 6122485
APN: 03-50158
Disclaimer: Certain information contained herein is derived from information provided by parties other than Homes.com. All information provided is deemed reliable, but is not guaranteed to be accurate and should be independently verified.
![]() IDX information is provided exclusively for personal, non-commercial use, and may not be used for any purpose other than to identify prospective properties consumers may be interested in purchasing. Information is deemed reliable but not guaranteed. ©2025 NORIS. All rights reserved.
IDX information is provided exclusively for personal, non-commercial use, and may not be used for any purpose other than to identify prospective properties consumers may be interested in purchasing. Information is deemed reliable but not guaranteed. ©2025 NORIS. All rights reserved.