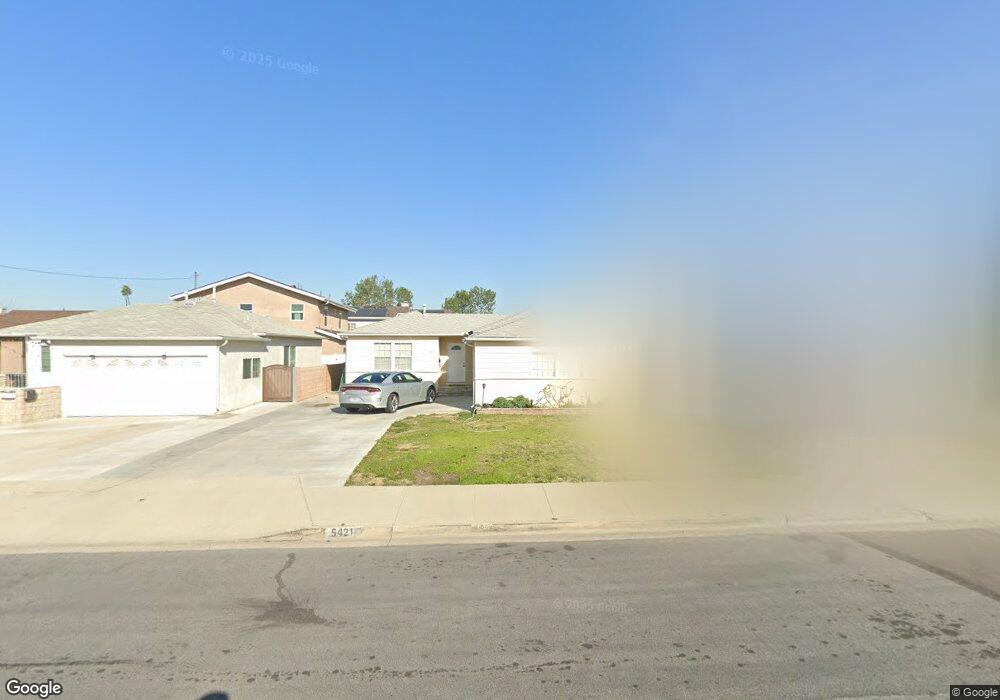
5421 Nelson St Cypress, CA 90630
Estimated Value: $835,000 - $900,000
3
Beds
1
Bath
1,248
Sq Ft
$691/Sq Ft
Est. Value
About This Home
This home is located at 5421 Nelson St, Cypress, CA 90630 and is currently estimated at $862,462, approximately $691 per square foot. 5421 Nelson St is a home located in Orange County with nearby schools including Clara J. King Elementary School, Lexington Junior High School, and Cypress High School.
Ownership History
Date
Name
Owned For
Owner Type
Purchase Details
Closed on
Mar 18, 1999
Sold by
Sipe Thomas and Sipe Linda
Bought by
Sipe Thomas and Sipe Linda
Current Estimated Value
Home Financials for this Owner
Home Financials are based on the most recent Mortgage that was taken out on this home.
Original Mortgage
$32,300
Interest Rate
6.73%
Mortgage Type
Stand Alone Second
Purchase Details
Closed on
Jan 15, 1997
Sold by
Sipe Thomas
Bought by
Sipe Thomas and Bennett Linda
Purchase Details
Closed on
Oct 1, 1996
Sold by
Kemmis Quincy J
Bought by
Sipe Thomas
Home Financials for this Owner
Home Financials are based on the most recent Mortgage that was taken out on this home.
Original Mortgage
$130,550
Interest Rate
7.88%
Mortgage Type
VA
Create a Home Valuation Report for This Property
The Home Valuation Report is an in-depth analysis detailing your home's value as well as a comparison with similar homes in the area
Home Values in the Area
Average Home Value in this Area
Purchase History
| Date | Buyer | Sale Price | Title Company |
|---|---|---|---|
| Sipe Thomas | -- | North American Title Co | |
| Sipe Thomas | -- | -- | |
| Sipe Thomas | $128,000 | Continental Lawyers Title Co |
Source: Public Records
Mortgage History
| Date | Status | Borrower | Loan Amount |
|---|---|---|---|
| Closed | Sipe Thomas | $32,300 | |
| Previous Owner | Sipe Thomas | $130,550 |
Source: Public Records
Tax History
| Year | Tax Paid | Tax Assessment Tax Assessment Total Assessment is a certain percentage of the fair market value that is determined by local assessors to be the total taxable value of land and additions on the property. | Land | Improvement |
|---|---|---|---|---|
| 2025 | $2,611 | $208,459 | $150,739 | $57,720 |
| 2024 | $2,611 | $204,372 | $147,783 | $56,589 |
| 2023 | $2,549 | $200,365 | $144,885 | $55,480 |
| 2022 | $2,515 | $196,437 | $142,044 | $54,393 |
| 2021 | $2,483 | $192,586 | $139,259 | $53,327 |
| 2020 | $2,471 | $190,612 | $137,831 | $52,781 |
| 2019 | $2,408 | $186,875 | $135,128 | $51,747 |
| 2018 | $2,377 | $183,211 | $132,478 | $50,733 |
| 2017 | $2,300 | $179,619 | $129,880 | $49,739 |
| 2016 | $2,280 | $176,098 | $127,334 | $48,764 |
| 2015 | $2,262 | $173,453 | $125,421 | $48,032 |
| 2014 | $2,149 | $170,056 | $122,964 | $47,092 |
Source: Public Records
Map
Nearby Homes
- 5342 Bishop St
- 5475 Twin Lakes Dr
- 5372 Harvard Way
- 9001 Cerise Ln Unit 109
- 9001 Cerise Ln Unit 113
- 9011 Cerise Ln Unit 129
- 6007 Clementine Ln Unit 21
- 5572 Saint Ann Ave
- 5000 Clementine Ln
- 9332 Nancy St
- 9598 Naples Dr
- 4842 Sapphire Way
- 8762 La Salle St
- 5930 Los Nietos St
- 9066 Candlestick Ln Unit 5
- 5353 Cumberland Dr
- 4790 Montefino Dr
- 8792 Valley View St Unit B
- 8521 Via Tina
- 9220 Whitney Way
Your Personal Tour Guide
Ask me questions while you tour the home.