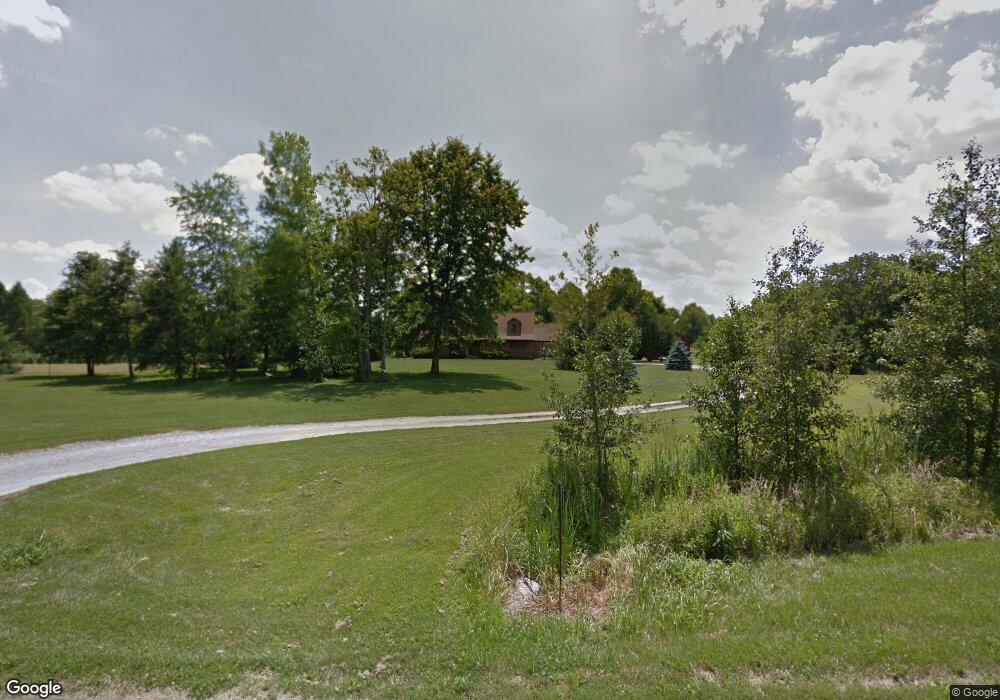
5421 Roachester Osceola Rd Morrow, OH 45152
Estimated Value: $385,000 - $541,000
3
Beds
2
Baths
2,707
Sq Ft
$164/Sq Ft
Est. Value
About This Home
This home is located at 5421 Roachester Osceola Rd, Morrow, OH 45152 and is currently estimated at $442,759, approximately $163 per square foot. 5421 Roachester Osceola Rd is a home located in Warren County with nearby schools including Little Miami Early Childhood Center, Little Miami Intermediate Middle School, and Little Miami Middle School.
Ownership History
Date
Name
Owned For
Owner Type
Purchase Details
Closed on
Jul 13, 2017
Sold by
Luzader Kenneth B and Luzader Linda J
Bought by
Landacre Christopher A
Current Estimated Value
Home Financials for this Owner
Home Financials are based on the most recent Mortgage that was taken out on this home.
Original Mortgage
$214,051
Outstanding Balance
$176,504
Interest Rate
3.62%
Mortgage Type
FHA
Estimated Equity
$266,255
Purchase Details
Closed on
Sep 2, 1998
Sold by
Kidd Terry A
Bought by
Luzader Kenneth B and Luzader Linda J
Purchase Details
Closed on
Oct 1, 1990
Sold by
Mcgeorge Robert D and Mcgeorge Ha
Bought by
Wolfe and Wolfe Paul B
Purchase Details
Closed on
May 2, 1990
Sold by
Beck Group Of Sugar Run
Bought by
Mcgeorge and Mcgeorge Robert D
Purchase Details
Closed on
Feb 26, 1985
Sold by
Mcgeorge Mcgeorge and Mcgeorge Robert D
Bought by
Beck Group Of Sugar Run
Purchase Details
Closed on
Feb 19, 1985
Sold by
Mcgeorge Robert D and Mcgeorge Ju
Bought by
Mcgeorge and Mcgeorge Robert D
Create a Home Valuation Report for This Property
The Home Valuation Report is an in-depth analysis detailing your home's value as well as a comparison with similar homes in the area
Home Values in the Area
Average Home Value in this Area
Purchase History
| Date | Buyer | Sale Price | Title Company |
|---|---|---|---|
| Landacre Christopher A | $218,000 | Mattingly Ford Title | |
| Luzader Kenneth B | $171,000 | -- | |
| Wolfe | $17,500 | -- | |
| Mcgeorge | $6,000 | -- | |
| Beck Group Of Sugar Run | $50,000 | -- | |
| Mcgeorge | -- | -- |
Source: Public Records
Mortgage History
| Date | Status | Borrower | Loan Amount |
|---|---|---|---|
| Open | Landacre Christopher A | $214,051 |
Source: Public Records
Tax History Compared to Growth
Tax History
| Year | Tax Paid | Tax Assessment Tax Assessment Total Assessment is a certain percentage of the fair market value that is determined by local assessors to be the total taxable value of land and additions on the property. | Land | Improvement |
|---|---|---|---|---|
| 2024 | $5,218 | $127,630 | $47,950 | $79,680 |
| 2023 | $4,533 | $100,282 | $29,774 | $70,507 |
| 2022 | $4,476 | $100,282 | $29,775 | $70,508 |
| 2021 | $4,242 | $100,282 | $29,775 | $70,508 |
| 2020 | $4,032 | $81,529 | $24,206 | $57,323 |
| 2019 | $4,178 | $81,529 | $24,206 | $57,323 |
| 2018 | $4,252 | $81,529 | $24,206 | $57,323 |
| 2017 | $3,576 | $76,979 | $23,373 | $53,606 |
| 2016 | $3,656 | $76,979 | $23,373 | $53,606 |
| 2015 | $3,661 | $76,979 | $23,373 | $53,606 |
| 2014 | $3,857 | $72,950 | $22,860 | $50,100 |
| 2013 | $4,301 | $83,460 | $24,210 | $59,250 |
Source: Public Records
Map
Nearby Homes
- 0 St Rt 132 Unit 1831981
- 5 Lundy-Whitacre Rd
- 7569 Woodward Claypool Rd
- 5.729ac Middleboro Rd
- 0 Middleboro Rd Unit 936129
- 0 Middleboro Rd Unit 1843780
- 7564 E Us Highway 22 and 3
- 7870 E U S 22
- 5565 E US Rt 22 & 3
- 7870 US Rt 22 & 3
- 6888 Edwardsville Rd
- 5467 Morrow-Blackhawk Rd
- 5182 Middleboro Rd
- 3172 Sage Ct
- 7564 E Us Rt 22 & 3
- 5323 US Rt 22 & 3
- 5199 Allens Ridge Dr
- 85ac Templin Rd
- 8842 Waynes Way
- 5168 Allens Ridge Dr
- 5419 Roachester Osceola Rd
- 5521 Roachester Osceola Rd
- 5479 Roachester Osceola Rd
- 5443 Roachester Osceola Rd
- 5417 Roachester Osceola Rd
- 5559 Roachester Osceola Rd
- 5500 Roachester Osceola Rd
- 5516 Roachester Osceola Rd
- 5562 Roachester Osceola Rd
- 5370 Roachester Osceola Rd
- 5550 Roachester Osceola Rd
- 5440 Roachester Osceola Rd
- 5039 Roachester Osceola Rd
- 11 Roachester Osceola Rd Unit 11
- 12 Roachester Osceola Rd Unit 12
- 6 Roachester Osceola Rd
- 5 Roachester Osceola Rd
- 8 Roachester Osceola Rd Unit 8
- 7 Roachester Osceola Rd Unit 7
- 1 Roachester Osceola Rd Unit 1