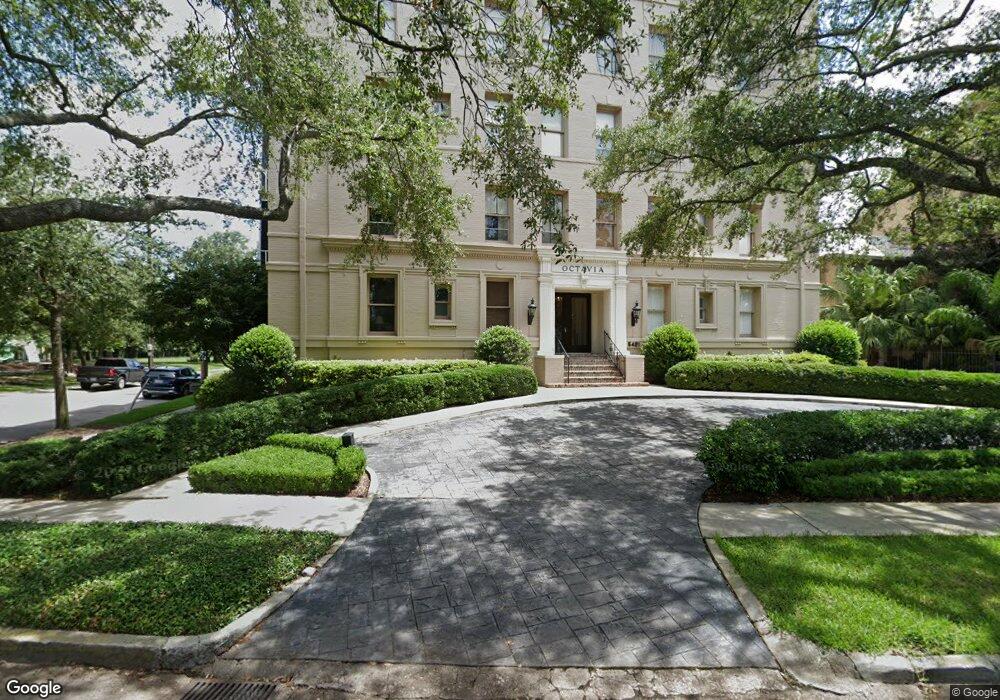
5421 St Charles Ave Unit 1D New Orleans, LA 70115
Audubon NeighborhoodEstimated Value: $396,909 - $473,000
1
Bed
1
Bath
1,016
Sq Ft
$437/Sq Ft
Est. Value
About This Home
This home is located at 5421 St Charles Ave Unit 1D, New Orleans, LA 70115 and is currently estimated at $443,727, approximately $436 per square foot. 5421 St Charles Ave Unit 1D is a home located in Orleans Parish with nearby schools including Benjamin Franklin Elementary, The Willow School New Orleans, and New Orleans Charter Science & Mathematics High School.
Ownership History
Date
Name
Owned For
Owner Type
Purchase Details
Closed on
Mar 30, 2018
Sold by
Veron J Michael
Bought by
Perez Lisa A
Current Estimated Value
Home Financials for this Owner
Home Financials are based on the most recent Mortgage that was taken out on this home.
Original Mortgage
$264,469
Outstanding Balance
$227,121
Interest Rate
4.38%
Mortgage Type
New Conventional
Estimated Equity
$216,606
Purchase Details
Closed on
Sep 12, 2016
Sold by
Mcnulty Mary Plauche and Mcnulty Michael J
Bought by
Veron J Michael
Purchase Details
Closed on
Mar 31, 2010
Sold by
Emmett Elizabeth H
Bought by
Westfeldt Shelby Scott
Home Financials for this Owner
Home Financials are based on the most recent Mortgage that was taken out on this home.
Original Mortgage
$184,000
Interest Rate
5%
Mortgage Type
New Conventional
Create a Home Valuation Report for This Property
The Home Valuation Report is an in-depth analysis detailing your home's value as well as a comparison with similar homes in the area
Home Values in the Area
Average Home Value in this Area
Purchase History
| Date | Buyer | Sale Price | Title Company |
|---|---|---|---|
| Perez Lisa A | $352,625 | Preservation Title | |
| Veron J Michael | $360,000 | Crescent Title Llc | |
| Westfeldt Shelby Scott | $230,000 | -- |
Source: Public Records
Mortgage History
| Date | Status | Borrower | Loan Amount |
|---|---|---|---|
| Open | Perez Lisa A | $264,469 | |
| Previous Owner | Westfeldt Shelby Scott | $184,000 |
Source: Public Records
Tax History Compared to Growth
Tax History
| Year | Tax Paid | Tax Assessment Tax Assessment Total Assessment is a certain percentage of the fair market value that is determined by local assessors to be the total taxable value of land and additions on the property. | Land | Improvement |
|---|---|---|---|---|
| 2025 | $5,852 | $39,750 | $3,640 | $36,110 |
| 2024 | $5,906 | $39,750 | $3,640 | $36,110 |
| 2023 | $5,414 | $36,410 | $2,420 | $33,990 |
| 2022 | $5,414 | $34,710 | $2,420 | $32,290 |
| 2021 | $5,771 | $36,410 | $2,420 | $33,990 |
| 2020 | $5,798 | $36,410 | $2,420 | $33,990 |
| 2019 | $4,672 | $27,580 | $2,420 | $25,160 |
| 2018 | $4,730 | $27,580 | $2,420 | $25,160 |
| 2017 | $4,513 | $27,580 | $2,420 | $25,160 |
| 2016 | $5,084 | $30,500 | $2,420 | $28,080 |
| 2015 | $4,989 | $30,500 | $2,120 | $28,380 |
| 2014 | -- | $23,000 | $2,120 | $20,880 |
| 2013 | -- | $23,000 | $2,120 | $20,880 |
Source: Public Records
Map
Nearby Homes
- 5421 St Charles Ave Unit 2D
- 5402 Saint Charles Ave
- 1824 Jefferson Ave
- 1514 Arabella St
- 5705 Saint Charles Ave
- 5721 Saint Charles Ave
- 1449 Arabella St
- 1633 Dufossat St
- 1467 Nashville Ave
- 1458 Nashville Ave
- 5528 Pitt St
- 2017 Jefferson Ave
- 5607 Prytania St Unit L
- 5607 Prytania St Unit E
- 5349 Prytania St
- 1631 State St
- 5421 St Charles Ave Unit 1B
- 5421 St Charles Ave Unit 1C
- 5421 St Charles Ave Unit 3C
- 5421 St Charles Ave Unit 2-A
- 5421 St Charles Ave Unit 4-A
- 5421 St Charles Ave Unit 3D
- 5421 St Charles Ave Unit 5B
- 5421 St Charles Ave Unit 5A
- 5421 St Charles Ave Unit 4C
- 5421 St Charles Ave Unit 3A
- 5421 St Charles Ave Unit 4B
- 5421 St Charles Ave
- 5421 St Charles Ave Unit 2B
- 5421 St Charles Ave Unit 1A
- 5421 St Charles Ave Unit 4D
- 5421 St Charles St Unit 1A
- 5421 Saint Charles Ave Unit 5B
- 5421 Saint Charles Ave Unit 5A
- 5421 Saint Charles Ave Unit 4D
- 5421 Saint Charles Ave Unit 4C