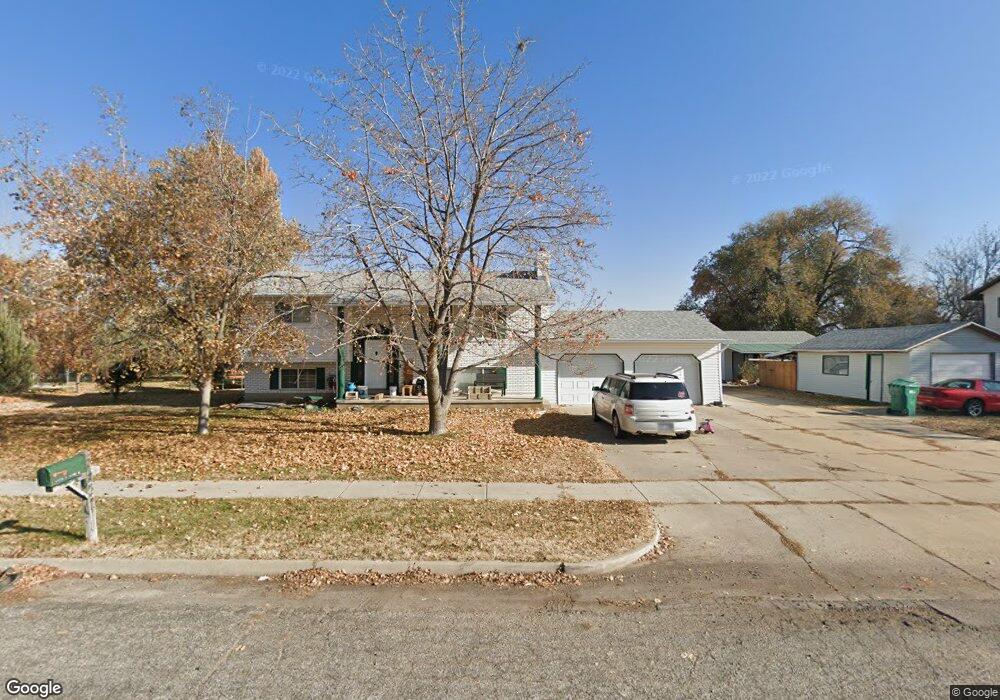
5422 S 5700 W Hooper, UT 84315
Estimated Value: $486,000 - $549,000
4
Beds
3
Baths
1,058
Sq Ft
$492/Sq Ft
Est. Value
About This Home
This home is located at 5422 S 5700 W, Hooper, UT 84315 and is currently estimated at $520,024, approximately $491 per square foot. 5422 S 5700 W is a home located in Weber County with nearby schools including Hooper Elementary School, Rocky Mountain Junior High School, and Fremont High School.
Ownership History
Date
Name
Owned For
Owner Type
Purchase Details
Closed on
Mar 12, 2021
Sold by
Sanford Kay Rulon
Bought by
Rulon S Kay Family Trust and Kay
Current Estimated Value
Home Financials for this Owner
Home Financials are based on the most recent Mortgage that was taken out on this home.
Original Mortgage
$373,117
Outstanding Balance
$334,473
Interest Rate
2.7%
Mortgage Type
FHA
Estimated Equity
$185,551
Purchase Details
Closed on
Mar 4, 1999
Sold by
Kay Rulon S and Kay Mary Lou
Bought by
Kay Rulon S and Kay Mary Lou
Create a Home Valuation Report for This Property
The Home Valuation Report is an in-depth analysis detailing your home's value as well as a comparison with similar homes in the area
Home Values in the Area
Average Home Value in this Area
Purchase History
| Date | Buyer | Sale Price | Title Company |
|---|---|---|---|
| Rulon S Kay Family Trust | -- | -- | |
| Hockin Sean | -- | Inwest Title Services Inc | |
| Hockin Sean | -- | Inwest Title | |
| Kay Rulon S | -- | -- |
Source: Public Records
Mortgage History
| Date | Status | Borrower | Loan Amount |
|---|---|---|---|
| Open | Hockin Sean | $373,117 |
Source: Public Records
Tax History Compared to Growth
Tax History
| Year | Tax Paid | Tax Assessment Tax Assessment Total Assessment is a certain percentage of the fair market value that is determined by local assessors to be the total taxable value of land and additions on the property. | Land | Improvement |
|---|---|---|---|---|
| 2025 | $2,726 | $475,486 | $149,715 | $325,771 |
| 2024 | $2,624 | $256,297 | $82,343 | $173,954 |
| 2023 | $2,506 | $242,550 | $82,391 | $160,159 |
| 2022 | $2,539 | $251,350 | $76,891 | $174,459 |
| 2021 | $2,140 | $357,000 | $94,763 | $262,237 |
| 2020 | $602 | $334,002 | $84,887 | $249,115 |
| 2019 | $2,082 | $301,001 | $59,964 | $241,037 |
| 2018 | $2,112 | $292,000 | $59,964 | $232,036 |
| 2017 | $1,838 | $246,000 | $60,080 | $185,920 |
| 2016 | $1,667 | $120,474 | $32,719 | $87,755 |
| 2015 | $1,633 | $116,295 | $32,719 | $83,576 |
| 2014 | $1,530 | $106,031 | $32,719 | $73,312 |
Source: Public Records
Map
Nearby Homes
- 0 W 5500 S
- 5335 W 5500 S
- 6014 W 5300 S
- 3632 S 5400 W
- 3729 S 5600 W Unit 6
- 3720 S 5600 W Unit 2
- 3719 S 5600 W Unit 7
- 5947 W 4600 S
- 4879 S 5050 W
- 6036 W 4700 S
- 4909 W 5850 S
- 4700 W 5500 S
- 4632 W 5750 S
- 4931 S 4700 W
- 2462 N Hooded Crane Ct
- 2444 N Hooded Crane Cir Unit 11
- 5752 W 2425 N
- 4146 S 5800 W Unit 5
- 4163 S 5800 W Unit 2
- 2084 N 4500 W