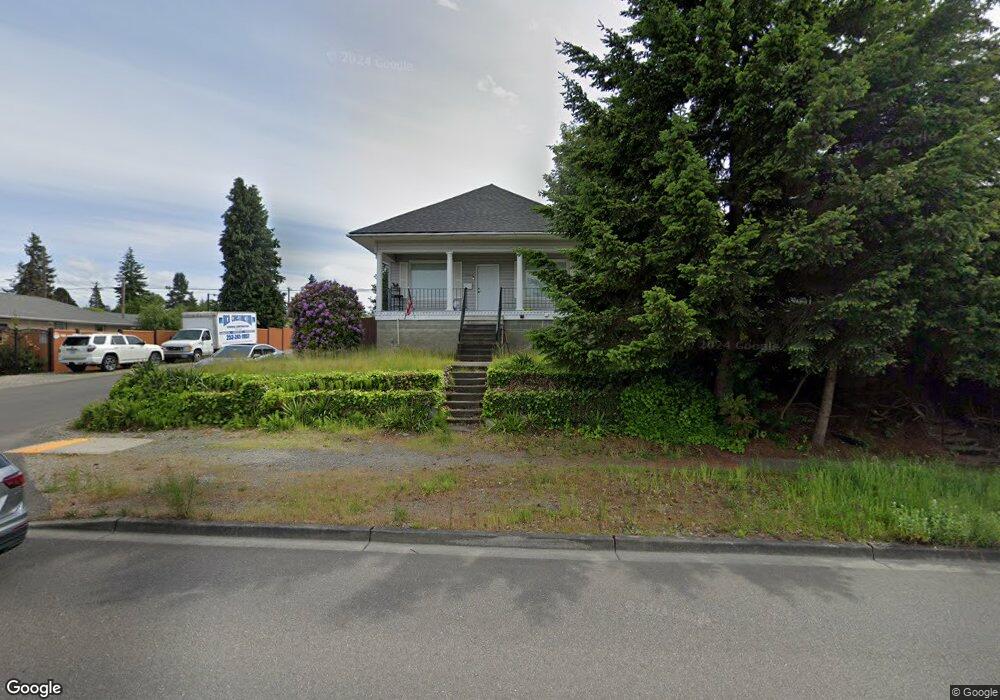
5424 N 46th St Tacoma, WA 98407
North Tacoma NeighborhoodEstimated Value: $504,771 - $621,000
3
Beds
2
Baths
614
Sq Ft
$903/Sq Ft
Est. Value
About This Home
This home is located at 5424 N 46th St, Tacoma, WA 98407 and is currently estimated at $554,443, approximately $903 per square foot. 5424 N 46th St is a home located in Pierce County with nearby schools including Point Defiance Elementary School, Truman Middle School, and Dr. Dolores Silas High School.
Ownership History
Date
Name
Owned For
Owner Type
Purchase Details
Closed on
Nov 3, 2023
Sold by
Wigney Ross
Bought by
Wigney Revocable Trust
Current Estimated Value
Purchase Details
Closed on
Jan 21, 2014
Sold by
Metropolitan Investments Lp
Bought by
Wigney Ross and Wigney Wendy Kathleen
Purchase Details
Closed on
Nov 21, 2008
Sold by
Wigney Ross and Wigney Wendy Kathleen
Bought by
Metropolitan Investments Lp
Purchase Details
Closed on
Mar 19, 2004
Sold by
Rhue Thomas E
Bought by
Wigney Ross and Wigney Wendy Kathleen
Purchase Details
Closed on
Dec 21, 1993
Sold by
Dolin Josephine A
Bought by
Rhue Thomas E
Home Financials for this Owner
Home Financials are based on the most recent Mortgage that was taken out on this home.
Original Mortgage
$70,500
Interest Rate
7.2%
Mortgage Type
FHA
Create a Home Valuation Report for This Property
The Home Valuation Report is an in-depth analysis detailing your home's value as well as a comparison with similar homes in the area
Home Values in the Area
Average Home Value in this Area
Purchase History
| Date | Buyer | Sale Price | Title Company |
|---|---|---|---|
| Wigney Revocable Trust | -- | None Listed On Document | |
| Wigney Ross | -- | None Available | |
| Metropolitan Investments Lp | -- | None Available | |
| Wigney Ross | $92,000 | First American Title Ins Co | |
| Rhue Thomas E | -- | Chicago Title |
Source: Public Records
Mortgage History
| Date | Status | Borrower | Loan Amount |
|---|---|---|---|
| Previous Owner | Rhue Thomas E | $70,500 |
Source: Public Records
Tax History Compared to Growth
Tax History
| Year | Tax Paid | Tax Assessment Tax Assessment Total Assessment is a certain percentage of the fair market value that is determined by local assessors to be the total taxable value of land and additions on the property. | Land | Improvement |
|---|---|---|---|---|
| 2025 | $5,164 | $504,400 | $313,800 | $190,600 |
| 2024 | $5,164 | $494,700 | $302,800 | $191,900 |
| 2023 | $5,164 | $463,900 | $262,700 | $201,200 |
| 2022 | $4,630 | $481,600 | $277,100 | $204,500 |
| 2021 | $4,303 | $342,300 | $176,400 | $165,900 |
| 2019 | $3,763 | $313,800 | $148,900 | $164,900 |
| 2018 | $4,238 | $289,500 | $134,200 | $155,300 |
| 2017 | $3,739 | $268,300 | $116,300 | $152,000 |
| 2016 | $3,329 | $203,200 | $87,900 | $115,300 |
| 2014 | $2,933 | $191,500 | $84,500 | $107,000 |
| 2013 | $2,933 | $175,100 | $75,700 | $99,400 |
Source: Public Records
Map
Nearby Homes
- 5507 N 45th St
- 5348 N 47th St
- 5333 N 47th St
- 4213 N Highland Ave
- 5128 N 48th St
- 4512 N Orchard St
- 5709 N 48th St
- 5302 N 49th St
- 5414 N 41st St
- 5016 N 43rd St
- 4202 N Pearl St
- 4610 N Defiance St
- 3932 N Highland St
- 5326 N Commercial St
- 5301 N Commercial St
- 4818 N Ferdinand St
- 4945 N Pearl St
- 4109 N Huson St
- 5106 N 39th St
- 4636 N Gove St