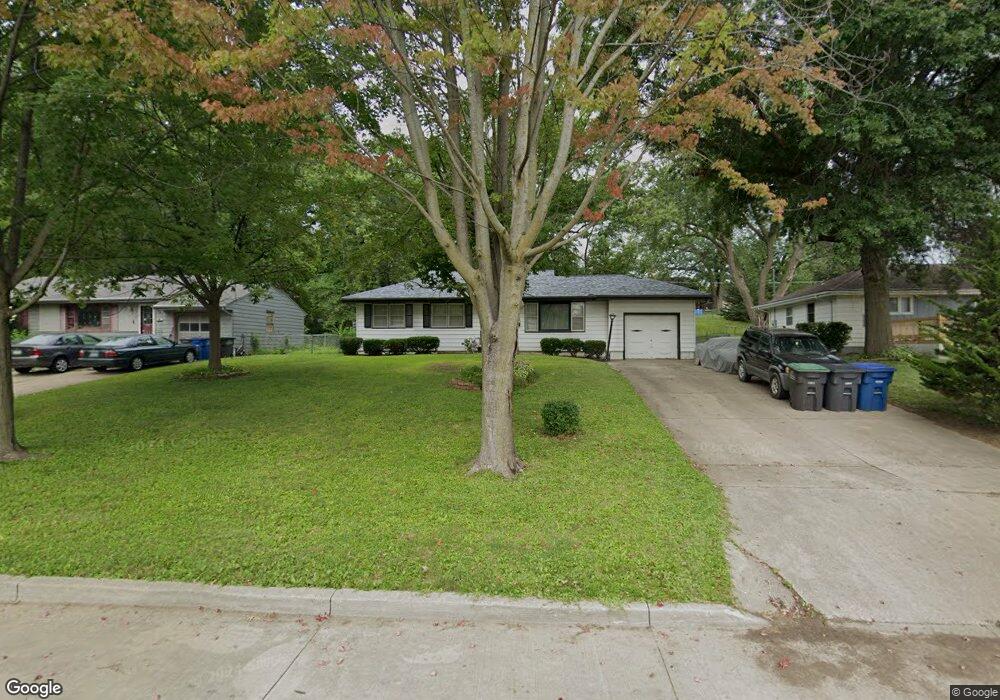
5424 SW 19th St Des Moines, IA 50315
Watrous South NeighborhoodEstimated Value: $211,988 - $234,000
3
Beds
1
Bath
1,052
Sq Ft
$213/Sq Ft
Est. Value
About This Home
This home is located at 5424 SW 19th St, Des Moines, IA 50315 and is currently estimated at $224,247, approximately $213 per square foot. 5424 SW 19th St is a home located in Polk County with nearby schools including Wright Elementary School, Brody Middle School, and Lincoln High School.
Ownership History
Date
Name
Owned For
Owner Type
Purchase Details
Closed on
Oct 9, 2024
Sold by
Larson Rachel A
Bought by
Rachel Ann Clevenger Living Trust and Larson
Current Estimated Value
Purchase Details
Closed on
Mar 24, 2004
Sold by
Larson Scott A and Larson Scott Alan
Bought by
Larson Rachel A and Larson Rachel Ann
Home Financials for this Owner
Home Financials are based on the most recent Mortgage that was taken out on this home.
Original Mortgage
$108,000
Interest Rate
8.15%
Mortgage Type
New Conventional
Purchase Details
Closed on
Mar 29, 2000
Sold by
Estate Of Glenys D Israel and Israel James R
Bought by
Larson Scott A and Larson Rachel A
Home Financials for this Owner
Home Financials are based on the most recent Mortgage that was taken out on this home.
Original Mortgage
$93,727
Interest Rate
8.22%
Mortgage Type
FHA
Create a Home Valuation Report for This Property
The Home Valuation Report is an in-depth analysis detailing your home's value as well as a comparison with similar homes in the area
Home Values in the Area
Average Home Value in this Area
Purchase History
| Date | Buyer | Sale Price | Title Company |
|---|---|---|---|
| Rachel Ann Clevenger Living Trust | -- | None Listed On Document | |
| Larson Rachel A | -- | Signature Title Company | |
| Larson Scott A | $94,000 | -- |
Source: Public Records
Mortgage History
| Date | Status | Borrower | Loan Amount |
|---|---|---|---|
| Previous Owner | Larson Rachel A | $108,000 | |
| Previous Owner | Larson Scott A | $93,727 |
Source: Public Records
Tax History Compared to Growth
Tax History
| Year | Tax Paid | Tax Assessment Tax Assessment Total Assessment is a certain percentage of the fair market value that is determined by local assessors to be the total taxable value of land and additions on the property. | Land | Improvement |
|---|---|---|---|---|
| 2025 | $3,694 | $215,800 | $37,700 | $178,100 |
| 2024 | $3,694 | $205,300 | $35,300 | $170,000 |
| 2023 | $3,704 | $205,300 | $35,300 | $170,000 |
| 2022 | $3,672 | $166,000 | $29,300 | $136,700 |
| 2021 | $3,568 | $166,000 | $29,300 | $136,700 |
| 2020 | $3,702 | $151,600 | $26,700 | $124,900 |
| 2019 | $3,410 | $151,600 | $26,700 | $124,900 |
| 2018 | $3,370 | $135,400 | $23,300 | $112,100 |
| 2017 | $3,142 | $135,400 | $23,300 | $112,100 |
| 2016 | $3,056 | $124,700 | $21,100 | $103,600 |
| 2015 | $3,056 | $124,700 | $21,100 | $103,600 |
| 2014 | $2,734 | $115,700 | $19,200 | $96,500 |
Source: Public Records
Map
Nearby Homes
- 5410 SW 20th St
- 1810 Porter Ave
- 1616 Porter Ave
- 1605 Frazier Ave
- 1616 Southlawn Dr
- 1401 Cutler Ave
- 5013 SW 16th St
- 5120 SW 14th St
- 4710 SW 16th St
- 1419 Payton Ave
- 1304 Wall Ave
- 4916 SW 13th St
- 1243 Hackley Ave
- 6001 SW 13th Place
- 1207 Kenyon Ave
- 1500 Leland Ave
- 6107 SW 14th St
- 1229 Evans St
- 2501 Mckinley Ave
- 1210 Highview Dr
- 5418 SW 19th St
- 5428 SW 19th St
- 5427 SW 20th St
- 5432 SW 19th St
- 5423 SW 20th St
- 5433 SW 20th St
- 5423 SW 19th St
- 5419 SW 19th St
- 5427 SW 19th St
- 5408 SW 19th St
- 5411 SW 20th St
- 5437 SW 20th St
- 5431 SW 19th St
- 5413 SW 19th St
- 5440 SW 19th St
- 5435 SW 19th St
- 5409 SW 19th St
- 5406 SW 19th St
- 1915 Porter Ave
- 5424 SW 20th St