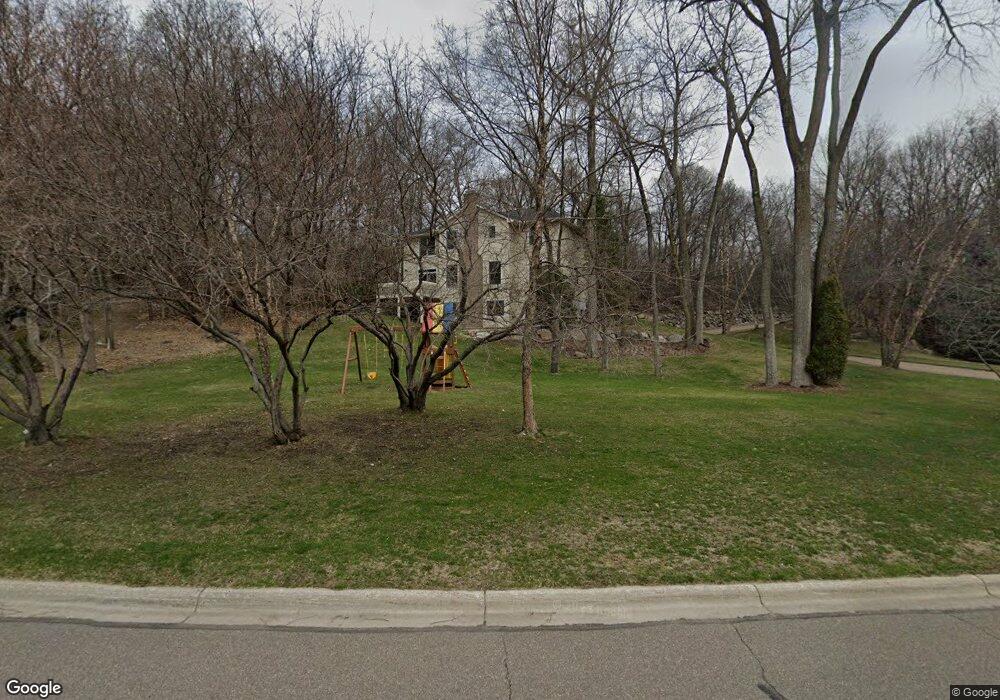
5424 Tamarack Cir Minnetonka, MN 55345
Estimated Value: $921,000 - $1,100,000
4
Beds
4
Baths
3,082
Sq Ft
$321/Sq Ft
Est. Value
About This Home
This home is located at 5424 Tamarack Cir, Minnetonka, MN 55345 and is currently estimated at $990,468, approximately $321 per square foot. 5424 Tamarack Cir is a home located in Hennepin County with nearby schools including Clear Springs Elementary School, Minnetonka West Middle School, and Minnetonka Senior High School.
Ownership History
Date
Name
Owned For
Owner Type
Purchase Details
Closed on
Jun 29, 2018
Sold by
Penny Todd and Penny Nadine W
Bought by
Gale Michael J and Gale Stephanie R
Current Estimated Value
Home Financials for this Owner
Home Financials are based on the most recent Mortgage that was taken out on this home.
Original Mortgage
$499,120
Outstanding Balance
$433,518
Interest Rate
4.6%
Mortgage Type
New Conventional
Estimated Equity
$556,950
Purchase Details
Closed on
Mar 9, 2006
Sold by
Bendix Mark and Bendix Nancy
Bought by
Penny Todd and Penny Nadine W
Purchase Details
Closed on
May 20, 1997
Sold by
Lundgren Bros Construction Inc
Bought by
Bendix Mark J and Bendix Nancy
Create a Home Valuation Report for This Property
The Home Valuation Report is an in-depth analysis detailing your home's value as well as a comparison with similar homes in the area
Home Values in the Area
Average Home Value in this Area
Purchase History
| Date | Buyer | Sale Price | Title Company |
|---|---|---|---|
| Gale Michael J | $629,900 | Midland Title | |
| Penny Todd | $689,900 | -- | |
| Bendix Mark J | $427,763 | -- |
Source: Public Records
Mortgage History
| Date | Status | Borrower | Loan Amount |
|---|---|---|---|
| Open | Gale Michael J | $499,120 |
Source: Public Records
Tax History Compared to Growth
Tax History
| Year | Tax Paid | Tax Assessment Tax Assessment Total Assessment is a certain percentage of the fair market value that is determined by local assessors to be the total taxable value of land and additions on the property. | Land | Improvement |
|---|---|---|---|---|
| 2024 | $11,420 | $805,600 | $234,700 | $570,900 |
| 2023 | $10,817 | $806,100 | $234,700 | $571,400 |
| 2022 | $9,980 | $791,800 | $234,700 | $557,100 |
| 2021 | $9,586 | $687,700 | $213,400 | $474,300 |
| 2020 | $9,652 | $665,600 | $213,400 | $452,200 |
| 2019 | $9,399 | $644,600 | $213,400 | $431,200 |
| 2018 | $9,243 | $627,600 | $213,400 | $414,200 |
| 2017 | $9,324 | $615,000 | $192,500 | $422,500 |
| 2016 | $10,797 | $697,100 | $190,000 | $507,100 |
| 2015 | $9,528 | $620,700 | $190,000 | $430,700 |
| 2014 | -- | $619,100 | $190,000 | $429,100 |
Source: Public Records
Map
Nearby Homes
- 5534 Conifer Trail
- 5130 Clear Spring Rd
- 17238 Millwood Rd
- 17034 Clear Spring Terrace
- 16848 Patricia Ln
- 5980 Covington Terrace
- 18502 Apple Tree Ct
- 18701 South Ln
- 18213 Hermitage Way
- 16816 Excelsior Blvd
- 4829 Lamplighters Ln
- 5026 Clear Spring Dr
- 18130 Covington Path
- 4906 Bayswater Rd
- 4941 West Ln
- 5800 Scenic Heights Dr
- 5826 Salisbury Ave
- 5034 Sparrow Rd
- 16515 Hilltop Terrace
- 4800 Woolman Ct
- 5450 Tamarack Cir
- 17925 Cynthia Dr
- 18001 Cynthia Dr
- 5427 Tamarack Cir
- 5416 Tamarack Cir
- 5439 Tamarack Cir
- 18009 Cynthia Dr
- 5433 Tamarack Cir
- 5442 Tamarack Cir
- 17917 Cynthia Dr
- 18025 Cynthia Dr
- 5421 Tamarack Cir
- 17825 Cynthia Dr
- 5501 Tamarack Cir
- 5408 Tamarack Cir
- 18004 Tamarack Dr
- 5458 Tamarack Cir
- 17815 Cynthia Dr
- 18000 Tamarack Dr
- 5341 Michaele Ln