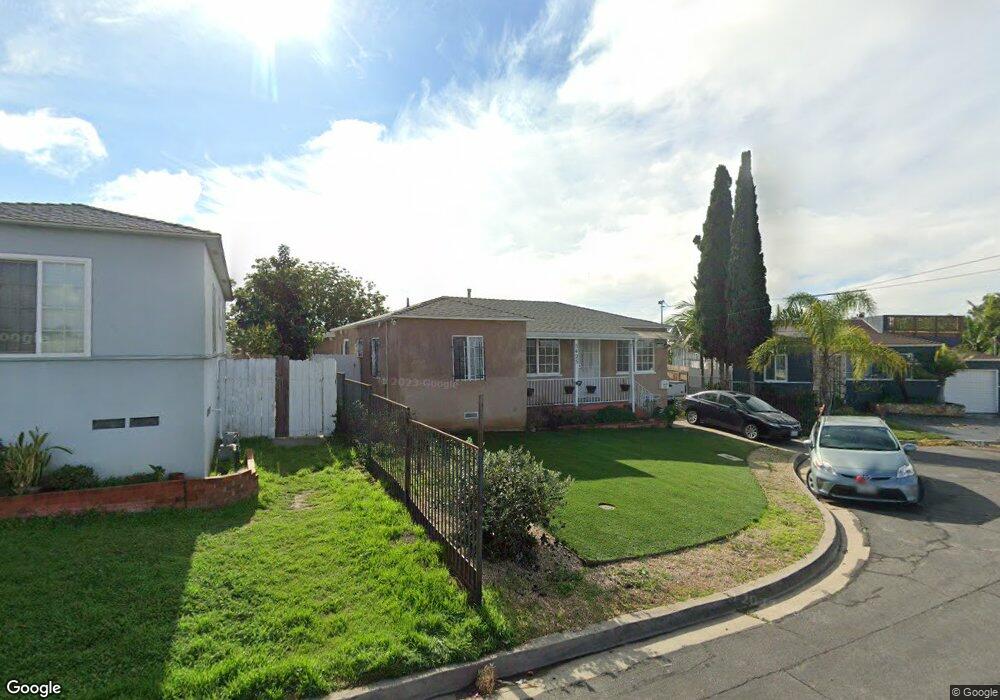
5425 Faulconer St San Diego, CA 92105
Oak Park NeighborhoodEstimated Value: $755,000 - $975,000
3
Beds
3
Baths
1,730
Sq Ft
$484/Sq Ft
Est. Value
About This Home
This home is located at 5425 Faulconer St, San Diego, CA 92105 and is currently estimated at $837,518, approximately $484 per square foot. 5425 Faulconer St is a home located in San Diego County with nearby schools including Oak Park Elementary School, Mann Middle School, and Crawford High School.
Ownership History
Date
Name
Owned For
Owner Type
Purchase Details
Closed on
Sep 10, 2021
Sold by
Le Hai Dang and Le Haidang H
Bought by
Le Hai Dang and The Haidang Le Living Trust
Current Estimated Value
Purchase Details
Closed on
Aug 14, 2015
Sold by
Sonesaksith Sysackda
Bought by
Le Haidang H
Home Financials for this Owner
Home Financials are based on the most recent Mortgage that was taken out on this home.
Original Mortgage
$323,493
Outstanding Balance
$253,905
Interest Rate
3.97%
Mortgage Type
VA
Estimated Equity
$583,613
Purchase Details
Closed on
Aug 12, 2014
Sold by
Sonesaksith Sysackda and Castro Raymond M
Bought by
Sonesaksith Sysackda
Purchase Details
Closed on
Jun 10, 2011
Sold by
Castro Simmaly A
Bought by
Castro Raymond M
Home Financials for this Owner
Home Financials are based on the most recent Mortgage that was taken out on this home.
Original Mortgage
$287,521
Interest Rate
4.75%
Mortgage Type
FHA
Purchase Details
Closed on
Jan 27, 2011
Sold by
Rucker Alvida L
Bought by
Aldine Corporation
Purchase Details
Closed on
Nov 19, 2010
Sold by
Rucker Lonzo
Bought by
Rucker Alvida L
Home Financials for this Owner
Home Financials are based on the most recent Mortgage that was taken out on this home.
Original Mortgage
$185,000
Interest Rate
4.18%
Mortgage Type
New Conventional
Purchase Details
Closed on
Nov 17, 2010
Sold by
The Bank Of New York Mellon
Bought by
Rucker Alvida L
Home Financials for this Owner
Home Financials are based on the most recent Mortgage that was taken out on this home.
Original Mortgage
$185,000
Interest Rate
4.18%
Mortgage Type
New Conventional
Purchase Details
Closed on
Apr 20, 2010
Sold by
Nguyen Hang Annie Trinh
Bought by
The Bank Of New York Mellon
Purchase Details
Closed on
Aug 25, 2004
Sold by
Nguyen Hung Tony
Bought by
Nguyen Annie and Nguyen Hang Anne Trinh
Home Financials for this Owner
Home Financials are based on the most recent Mortgage that was taken out on this home.
Original Mortgage
$297,500
Interest Rate
5.25%
Mortgage Type
New Conventional
Purchase Details
Closed on
Mar 11, 2003
Sold by
Miner Mary
Bought by
Nguyen Hang Annie Trinh
Home Financials for this Owner
Home Financials are based on the most recent Mortgage that was taken out on this home.
Original Mortgage
$220,000
Interest Rate
5.6%
Purchase Details
Closed on
Dec 20, 1995
Sold by
Miner Charles Howard
Bought by
Miner Mary C
Create a Home Valuation Report for This Property
The Home Valuation Report is an in-depth analysis detailing your home's value as well as a comparison with similar homes in the area
Home Values in the Area
Average Home Value in this Area
Purchase History
| Date | Buyer | Sale Price | Title Company |
|---|---|---|---|
| Le Hai Dang | -- | None Available | |
| Le Haidang H | $415,000 | Title 365 | |
| Sonesaksith Sysackda | -- | None Available | |
| Castro Raymond M | -- | Fidelity National Title Co | |
| Sonesaksith Sysackda | $295,000 | Fidelity National Title Co | |
| Aldine Corporation | -- | Accommodation | |
| Rucker Alvida L | -- | None Available | |
| Rucker Alvida L | $155,000 | None Available | |
| The Bank Of New York Mellon | $236,250 | Landsafe Title | |
| Nguyen Annie | -- | Commonwealth Land Title Co | |
| Nguyen Hang Annie Trinh | $275,000 | Commonwealth Land Title Co | |
| Miner Mary C | -- | First American Title Co |
Source: Public Records
Mortgage History
| Date | Status | Borrower | Loan Amount |
|---|---|---|---|
| Open | Le Haidang H | $323,493 | |
| Previous Owner | Sonesaksith Sysackda | $287,521 | |
| Previous Owner | Rucker Alvida L | $185,000 | |
| Previous Owner | Nguyen Annie | $297,500 | |
| Previous Owner | Nguyen Hang Annie Trinh | $220,000 |
Source: Public Records
Tax History Compared to Growth
Tax History
| Year | Tax Paid | Tax Assessment Tax Assessment Total Assessment is a certain percentage of the fair market value that is determined by local assessors to be the total taxable value of land and additions on the property. | Land | Improvement |
|---|---|---|---|---|
| 2025 | $5,864 | $491,267 | $236,470 | $254,797 |
| 2024 | $5,864 | $481,635 | $231,834 | $249,801 |
| 2023 | $5,733 | $472,192 | $227,289 | $244,903 |
| 2022 | $5,579 | $462,934 | $222,833 | $240,101 |
| 2021 | $5,539 | $453,858 | $218,464 | $235,394 |
| 2020 | $5,471 | $449,205 | $216,224 | $232,981 |
| 2019 | $5,372 | $440,398 | $211,985 | $228,413 |
| 2018 | $5,022 | $431,764 | $207,829 | $223,935 |
| 2017 | $4,901 | $423,299 | $203,754 | $219,545 |
| 2016 | $4,821 | $415,000 | $199,759 | $215,241 |
| 2015 | $3,641 | $314,468 | $131,874 | $182,594 |
| 2014 | $3,583 | $308,309 | $129,291 | $179,018 |
Source: Public Records
Map
Nearby Homes
- 5550 Grape St
- 5251 Laurel St
- 2003 Bayview Heights Dr Unit SPC 109
- 2003 Bayview Heights Dr Unit 157
- 2003 Bayview Hts Dr Unit 158
- 1845 Bayview Heights Dr Unit 103
- 1675 Pentecost Way Unit 3
- 1641 Pentecost Way Unit 10
- 1627 Pentecost Way Unit 7
- 1653 Pentecost Way Unit 12
- 1651 Pentecost Way Unit 1
- 1687 Pentecost Way Unit 4
- 5359 Caminito Mindy
- 3134 Winlow St
- 5468 Chollas Station Rd
- 1951 47th St Unit 53
- 1951 47th St Unit 118
- 1951 47th St Unit 69
- 2503 2501 Sumac Dr
- 0 Redwood St Unit IG25200939
- 5435 Faulconer St
- 5474 Timothy Dr
- 5415 Faulconer St
- 5478 Timothy Dr
- 5470 Timothy Dr
- 5445 Faulconer St
- 5430 Faulconer St
- 5482 Timothy Dr
- 5405 Faulconer St
- 5466 Timothy Dr
- 2309 Blackton Dr
- 2302 Blackton Dr
- 5455 Faulconer St
- 5486 Timothy Dr
- 2310 Blackton Dr
- 2317 Blackton Dr
- 5462 Timothy Dr
- 5465 Timothy Dr
- 5481 Timothy Dr
- 2302 55th St