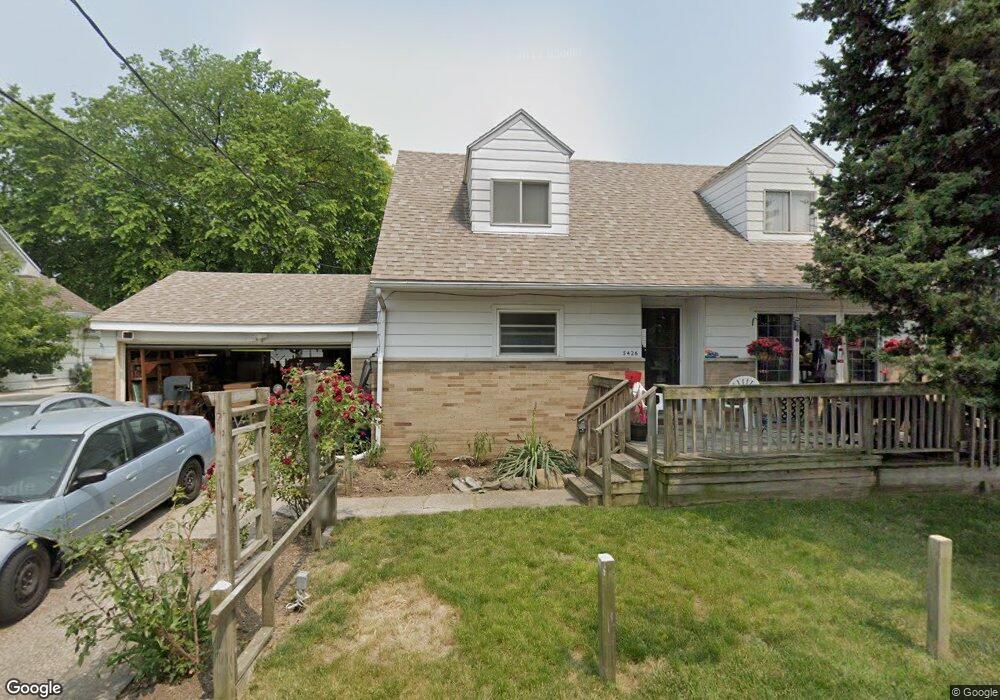
5426 310th St Toledo, OH 43611
Point Place NeighborhoodEstimated Value: $176,000 - $183,000
3
Beds
3
Baths
1,868
Sq Ft
$97/Sq Ft
Est. Value
About This Home
This home is located at 5426 310th St, Toledo, OH 43611 and is currently estimated at $180,426, approximately $96 per square foot. 5426 310th St is a home located in Lucas County with nearby schools including Edgewater Elementary School and Woodward High School.
Ownership History
Date
Name
Owned For
Owner Type
Purchase Details
Closed on
Apr 14, 1989
Sold by
Shank Charles W and Shank Glenna
Current Estimated Value
Purchase Details
Closed on
Aug 29, 1988
Sold by
Fox G J and S J
Create a Home Valuation Report for This Property
The Home Valuation Report is an in-depth analysis detailing your home's value as well as a comparison with similar homes in the area
Home Values in the Area
Average Home Value in this Area
Purchase History
| Date | Buyer | Sale Price | Title Company |
|---|---|---|---|
| -- | $53,900 | -- | |
| -- | $45,000 | -- |
Source: Public Records
Tax History Compared to Growth
Tax History
| Year | Tax Paid | Tax Assessment Tax Assessment Total Assessment is a certain percentage of the fair market value that is determined by local assessors to be the total taxable value of land and additions on the property. | Land | Improvement |
|---|---|---|---|---|
| 2024 | $3,157 | $45,220 | $5,670 | $39,550 |
| 2023 | $2,516 | $37,415 | $4,865 | $32,550 |
| 2022 | $2,503 | $37,415 | $4,865 | $32,550 |
| 2021 | $2,574 | $37,415 | $4,865 | $32,550 |
| 2020 | $2,503 | $31,675 | $4,025 | $27,650 |
| 2019 | $2,420 | $31,675 | $4,025 | $27,650 |
| 2018 | $2,433 | $31,675 | $4,025 | $27,650 |
| 2017 | $2,280 | $28,350 | $4,585 | $23,765 |
| 2016 | $2,297 | $81,000 | $13,100 | $67,900 |
| 2015 | $2,305 | $81,000 | $13,100 | $67,900 |
| 2014 | $1,783 | $28,360 | $4,590 | $23,770 |
| 2013 | $1,783 | $28,360 | $4,590 | $23,770 |
Source: Public Records
Map
Nearby Homes