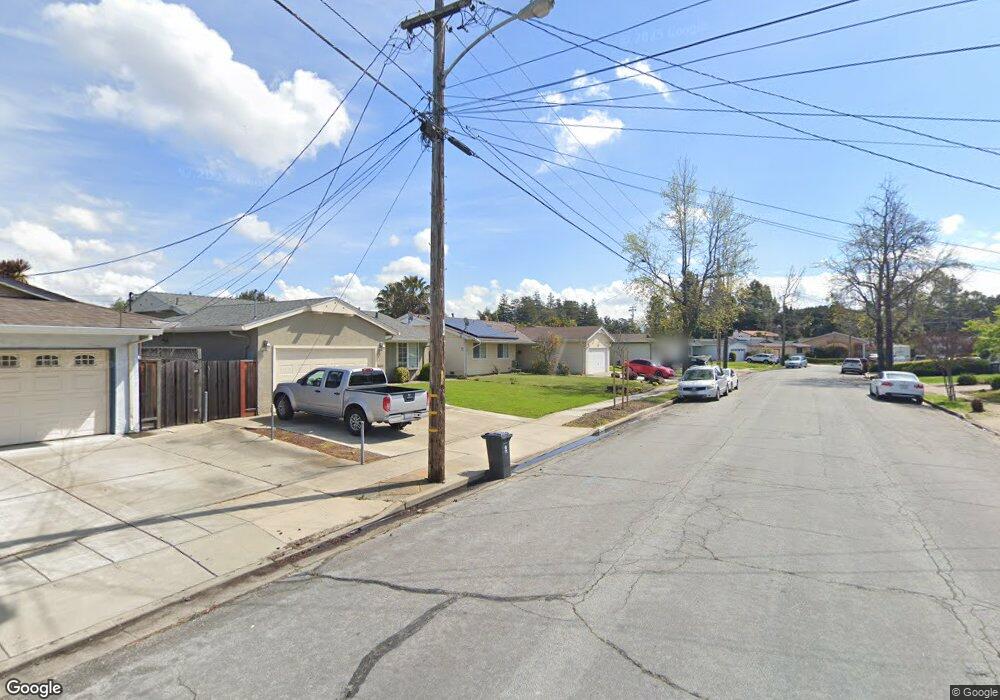
5426 Jonathan Dr Newark, CA 94560
Estimated Value: $1,107,000 - $1,256,000
3
Beds
2
Baths
1,314
Sq Ft
$900/Sq Ft
Est. Value
About This Home
This home is located at 5426 Jonathan Dr, Newark, CA 94560 and is currently estimated at $1,182,201, approximately $899 per square foot. 5426 Jonathan Dr is a home located in Alameda County with nearby schools including Newark Junior High School, Newark Memorial High School, and Montessori School of Newark.
Ownership History
Date
Name
Owned For
Owner Type
Purchase Details
Closed on
Sep 26, 2003
Sold by
Farley Gregory William
Bought by
Miller Timothy and Miller Sharon
Current Estimated Value
Home Financials for this Owner
Home Financials are based on the most recent Mortgage that was taken out on this home.
Original Mortgage
$356,000
Outstanding Balance
$166,245
Interest Rate
6.22%
Mortgage Type
Purchase Money Mortgage
Estimated Equity
$1,015,956
Purchase Details
Closed on
Jan 16, 1996
Sold by
Schroeder Stephen D and Schroeder Sharon J
Bought by
Farley Gregory William
Home Financials for this Owner
Home Financials are based on the most recent Mortgage that was taken out on this home.
Original Mortgage
$173,400
Interest Rate
7.18%
Mortgage Type
Assumption
Create a Home Valuation Report for This Property
The Home Valuation Report is an in-depth analysis detailing your home's value as well as a comparison with similar homes in the area
Home Values in the Area
Average Home Value in this Area
Purchase History
| Date | Buyer | Sale Price | Title Company |
|---|---|---|---|
| Miller Timothy | $445,000 | Ticor Title Company Of Ca | |
| Farley Gregory William | $173,500 | Old Republic Title Company |
Source: Public Records
Mortgage History
| Date | Status | Borrower | Loan Amount |
|---|---|---|---|
| Open | Miller Timothy | $356,000 | |
| Previous Owner | Farley Gregory William | $173,400 | |
| Closed | Miller Timothy | $89,000 |
Source: Public Records
Tax History
| Year | Tax Paid | Tax Assessment Tax Assessment Total Assessment is a certain percentage of the fair market value that is determined by local assessors to be the total taxable value of land and additions on the property. | Land | Improvement |
|---|---|---|---|---|
| 2025 | $7,831 | $457,362 | $189,798 | $442,862 |
| 2024 | $7,831 | $613,258 | $186,077 | $434,181 |
| 2023 | $7,615 | $608,096 | $182,429 | $425,667 |
| 2022 | $7,515 | $589,174 | $178,852 | $417,322 |
| 2021 | $7,327 | $577,488 | $175,346 | $409,142 |
| 2020 | $7,220 | $578,500 | $173,550 | $404,950 |
| 2019 | $7,117 | $567,156 | $170,147 | $397,009 |
| 2018 | $7,009 | $556,035 | $166,810 | $389,225 |
| 2017 | $6,830 | $545,133 | $163,540 | $381,593 |
| 2016 | $6,759 | $534,444 | $160,333 | $374,111 |
| 2015 | $6,735 | $526,417 | $157,925 | $368,492 |
| 2014 | $6,311 | $496,000 | $148,800 | $347,200 |
Source: Public Records
Map
Nearby Homes
- 36255 Casey Ct
- 5585 Fernwood Dr
- 5311 Port Sailwood Dr
- 5874 Caleb Ct
- 5298 Sussex Place
- 36465 Hafner St
- 36057 Dalewood Dr
- 35952 Rosewood Dr
- 6048 Bellhaven Ave
- 5912 Mayhews Landing Rd
- 36302 Tunbridge Dr
- 37141 Saint Christopher St
- 36202 Worthing Dr
- 37164 Saint Christopher St
- 5030 Chelsea Dr
- 4987 Winchester Place
- 35415 Blackburn Dr
- 6328 Zulmida Ave
- 35605 Scarborough Dr
- 36347 Magellan Dr
- 5420 Jonathan Dr
- 5436 Jonathan Dr
- 5408 Mclaughlin Ave
- 5414 Jonathan Dr
- 5444 Jonathan Dr
- 5402 Mclaughlin Ave
- 5425 Jonathan Dr
- 5435 Jonathan Dr
- 36463 Cedar Blvd
- 5419 Jonathan Dr
- 36481 Cedar Blvd
- 5452 Jonathan Dr
- 5443 Jonathan Dr
- 36445 Cedar Blvd
- 36396 Sandalwood St
- 5413 Jonathan Dr
- 36507 Cedar Blvd
- 36427 Cedar Blvd
- 5489 Jonathan Place
- 36377 Sandalwood St
Your Personal Tour Guide
Ask me questions while you tour the home.