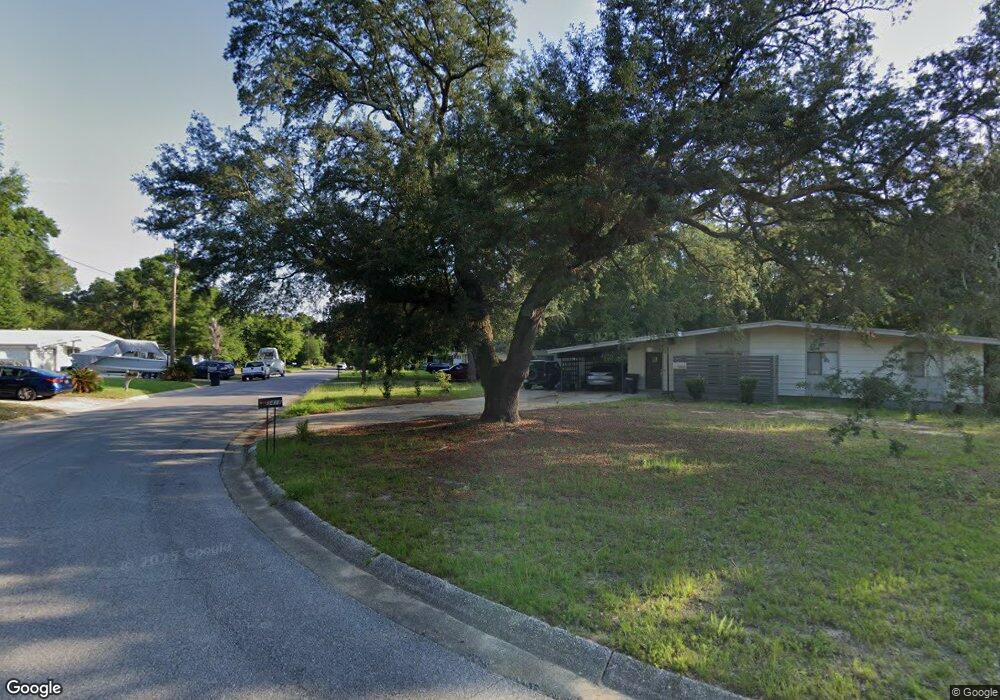
5426 Thornhill Rd Pensacola, FL 32503
Estimated Value: $169,605 - $251,000
--
Bed
2
Baths
1,256
Sq Ft
$170/Sq Ft
Est. Value
About This Home
This home is located at 5426 Thornhill Rd, Pensacola, FL 32503 and is currently estimated at $213,901, approximately $170 per square foot. 5426 Thornhill Rd is a home located in Escambia County with nearby schools including O.J. Semmes Elementary School, J.H. Workman Middle School, and Booker T. Washington High School.
Ownership History
Date
Name
Owned For
Owner Type
Purchase Details
Closed on
Oct 11, 2023
Sold by
Natoli Bernice M
Bought by
Natoli Bernice M
Current Estimated Value
Purchase Details
Closed on
Dec 28, 2020
Sold by
Natoli Bernice M
Bought by
Natoli Bernice M and Muradov Toni
Purchase Details
Closed on
May 5, 1998
Sold by
Harrer Charles M
Bought by
Natoli Bernice M
Home Financials for this Owner
Home Financials are based on the most recent Mortgage that was taken out on this home.
Original Mortgage
$54,000
Interest Rate
6.98%
Mortgage Type
New Conventional
Purchase Details
Closed on
May 2, 1997
Sold by
Hartley Randee L and Wilson Randee L
Bought by
Harrer Charles M
Home Financials for this Owner
Home Financials are based on the most recent Mortgage that was taken out on this home.
Original Mortgage
$53,574
Interest Rate
7.98%
Mortgage Type
FHA
Create a Home Valuation Report for This Property
The Home Valuation Report is an in-depth analysis detailing your home's value as well as a comparison with similar homes in the area
Home Values in the Area
Average Home Value in this Area
Purchase History
| Date | Buyer | Sale Price | Title Company |
|---|---|---|---|
| Natoli Bernice M | -- | None Listed On Document | |
| Natoli Bernice M | -- | None Listed On Document | |
| Natoli Bernice M | -- | None Available | |
| Natoli Bernice M | $62,000 | -- | |
| Harrer Charles M | $54,000 | -- |
Source: Public Records
Mortgage History
| Date | Status | Borrower | Loan Amount |
|---|---|---|---|
| Previous Owner | Natoli Bernice M | $54,000 | |
| Previous Owner | Harrer Charles M | $53,574 |
Source: Public Records
Tax History Compared to Growth
Tax History
| Year | Tax Paid | Tax Assessment Tax Assessment Total Assessment is a certain percentage of the fair market value that is determined by local assessors to be the total taxable value of land and additions on the property. | Land | Improvement |
|---|---|---|---|---|
| 2024 | $1,962 | $136,740 | $32,000 | $104,740 |
| 2023 | $1,962 | $105,165 | $0 | $0 |
| 2022 | $1,737 | $106,469 | $18,000 | $88,469 |
| 2021 | $1,573 | $87,657 | $0 | $0 |
| 2020 | $1,410 | $79,013 | $0 | $0 |
| 2019 | $1,342 | $77,746 | $0 | $0 |
| 2018 | $1,256 | $72,578 | $0 | $0 |
| 2017 | $1,128 | $60,184 | $0 | $0 |
| 2016 | $1,118 | $58,824 | $0 | $0 |
| 2015 | $1,091 | $56,556 | $0 | $0 |
| 2014 | $1,088 | $55,896 | $0 | $0 |
Source: Public Records
Map
Nearby Homes
- 773 Alpine Dr
- 0 Creek Station Dr Unit 613738
- 6108 Walton St
- 520 Selina St
- 4929 Springhill Dr
- 6000 Hermitage Dr
- 4770 Skyline Dr
- 6051 Biscayne Ct
- 6100 Drexel Rd
- 5969 Hermitage Dr
- 351 Springdale Cir
- 960 Langley Ave
- 1050 Langley Ave
- 965 Farmington Rd
- 0000 Carpenter Creek Dr
- 4304 Bishop St
- 533 Ditmar St
- 272 Saint Patrick Ave
- 675 Farmington Rd
- 406 Hancock Ln
- 5418 Thornhill Rd
- 0 Thornhill Rd
- 5425 Evergreen Rd
- 5411 Evergreen Rd
- 5442 Thornhill Rd
- 5439 Evergreen Rd
- 5433 Thornhill Rd
- 5429 Thornhill Rd
- 5453 Evergreen Rd
- 5445 Thornhill Rd
- 5454 Thornhill Rd
- 5405 Thornhill Rd
- 5417 Thornhill Rd
- 5457 Thornhill Rd
- 0 Evergreen Rd Unit 383270
- 0 Evergreen Rd Unit 394354
- 0 Evergreen Rd Unit 406059
- 0 Evergreen Rd Unit 420629
- 0 Evergreen Rd Unit 461955
- 0 Evergreen Rd Unit 2ND ADDN 468442