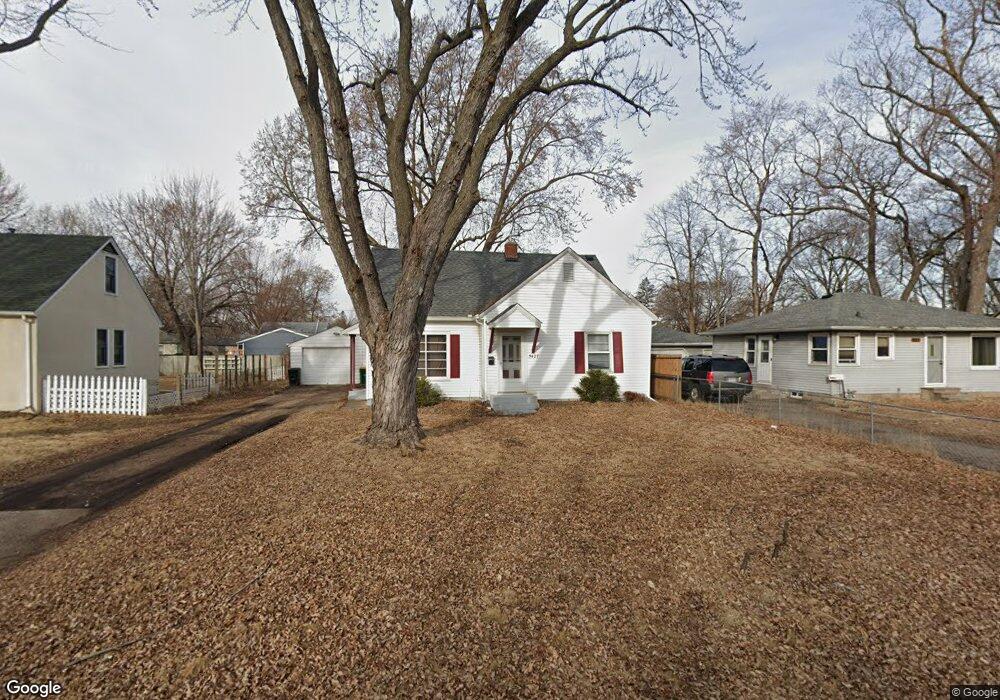
5427 Dupont Ave N Minneapolis, MN 55430
Bellvue NeighborhoodEstimated Value: $287,000 - $306,000
4
Beds
2
Baths
1,762
Sq Ft
$168/Sq Ft
Est. Value
About This Home
This home is located at 5427 Dupont Ave N, Minneapolis, MN 55430 and is currently estimated at $295,943, approximately $167 per square foot. 5427 Dupont Ave N is a home located in Hennepin County with nearby schools including Brooklyn Center Elementary STEAM, Bright Water MontessoriSchool, and KIPP North Star Primary.
Ownership History
Date
Name
Owned For
Owner Type
Purchase Details
Closed on
Jan 5, 2021
Sold by
Palmer Sarah and Palmer Derrick Bradford
Bought by
Nelson Sarah Elizabeth
Current Estimated Value
Home Financials for this Owner
Home Financials are based on the most recent Mortgage that was taken out on this home.
Original Mortgage
$232,750
Interest Rate
2.7%
Mortgage Type
New Conventional
Purchase Details
Closed on
Mar 25, 2009
Sold by
Federal National Mortgage Association
Bought by
Palmer Sarah
Purchase Details
Closed on
May 24, 2007
Sold by
Bass Natalie S and Bass Michael Jerome
Bought by
Acheaw Kumi and King Stephen P
Purchase Details
Closed on
Jan 9, 2003
Sold by
Johnson Scott A
Bought by
Bass Michael Jerome and Bass Natalie S
Purchase Details
Closed on
Aug 21, 2000
Sold by
Eklund A Dorene and Eklund Lee Ann
Bought by
Johnson Scott A
Create a Home Valuation Report for This Property
The Home Valuation Report is an in-depth analysis detailing your home's value as well as a comparison with similar homes in the area
Home Values in the Area
Average Home Value in this Area
Purchase History
| Date | Buyer | Sale Price | Title Company |
|---|---|---|---|
| Nelson Sarah Elizabeth | $245,000 | Burnet Title | |
| Palmer Sarah | $77,000 | -- | |
| Acheaw Kumi | $220,000 | -- | |
| Bass Michael Jerome | $184,500 | -- | |
| Johnson Scott A | $107,000 | -- | |
| Nelson Sarah Sarah | $245,000 | -- |
Source: Public Records
Mortgage History
| Date | Status | Borrower | Loan Amount |
|---|---|---|---|
| Previous Owner | Nelson Sarah Elizabeth | $232,750 | |
| Closed | Nelson Sarah Sarah | $232,750 |
Source: Public Records
Tax History Compared to Growth
Tax History
| Year | Tax Paid | Tax Assessment Tax Assessment Total Assessment is a certain percentage of the fair market value that is determined by local assessors to be the total taxable value of land and additions on the property. | Land | Improvement |
|---|---|---|---|---|
| 2024 | $4,196 | $275,900 | $67,000 | $208,900 |
| 2023 | $3,961 | $265,100 | $55,000 | $210,100 |
| 2022 | $3,315 | $268,000 | $61,000 | $207,000 |
| 2021 | $3,838 | $230,000 | $51,000 | $179,000 |
| 2020 | $3,498 | $219,000 | $48,000 | $171,000 |
| 2019 | $2,628 | $198,000 | $41,000 | $157,000 |
| 2018 | $2,481 | $160,000 | $50,000 | $110,000 |
| 2017 | $2,066 | $139,000 | $35,000 | $104,000 |
| 2016 | $2,262 | $137,600 | $40,000 | $97,600 |
| 2015 | $1,975 | $127,200 | $35,900 | $91,300 |
| 2014 | -- | $116,900 | $34,400 | $82,500 |
Source: Public Records
Map
Nearby Homes
- 5513 Bryant Ave N
- 5527 Fremont Ave N
- 5238 Fremont Ave N
- 5524 Humboldt Ave N
- 5447 N 4th St
- 1107 57th Ave N
- 5654 Bryant Ave N
- 5200 Aldrich Ave N
- 5239 N 6th St
- 810 57th Ave N
- 5121 Aldrich Ave N
- 5050 Emerson Ave N
- 5247 James Ave N
- 5053 Girard Ave N
- 5037 Camden Ave N
- 5818 Emerson Ave N
- 5716 James Ave N
- 5136 James Ave N
- 5118 James Ave N
- 4936 Fremont Ave N
- 5421 Dupont Ave N
- 5433 Dupont Ave N
- 5415 Dupont Ave N
- 5441 Dupont Ave N
- 5436 Emerson Ave N
- 5424 Emerson Ave N
- 5407 Dupont Ave N
- 5447 Dupont Ave N
- 5420 Emerson Ave N
- 5448 Emerson Ave N
- 5432 Dupont Ave N
- 5438 Dupont Ave N
- 5416 Dupont Ave N
- 5444 Dupont Ave N
- 5412 Emerson Ave N
- 5452 Emerson Ave N
- 5401 Dupont Ave N
- 5451 Dupont Ave N
- 5408 Dupont Ave N
- 5448 Dupont Ave N