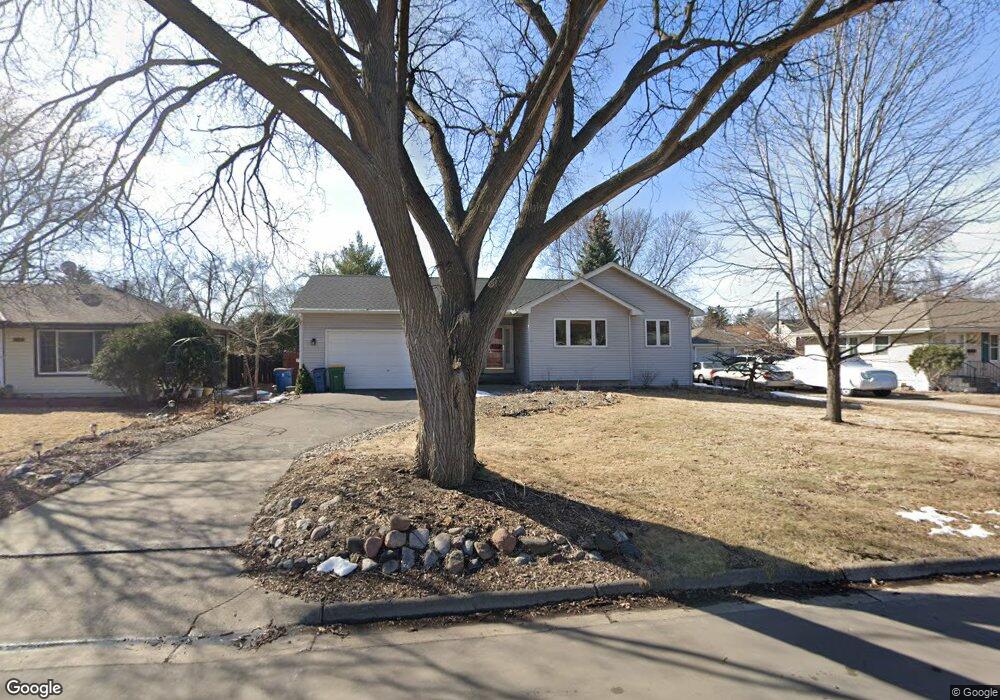
5427 Knox Ave N Minneapolis, MN 55430
Lions NeighborhoodEstimated Value: $313,000 - $361,000
3
Beds
2
Baths
1,809
Sq Ft
$183/Sq Ft
Est. Value
About This Home
This home is located at 5427 Knox Ave N, Minneapolis, MN 55430 and is currently estimated at $331,052, approximately $183 per square foot. 5427 Knox Ave N is a home located in Hennepin County with nearby schools including Brooklyn Center Elementary STEAM, Progeny Academy, and Bright Water MontessoriSchool.
Ownership History
Date
Name
Owned For
Owner Type
Purchase Details
Closed on
Jan 16, 2023
Sold by
Stiles John Lee
Bought by
Stiles Sandra Ann
Current Estimated Value
Purchase Details
Closed on
Sep 19, 2019
Sold by
Nordness Dean E and Nordness Joelle M
Bought by
Stiles John L and Stiles Sandra A
Home Financials for this Owner
Home Financials are based on the most recent Mortgage that was taken out on this home.
Original Mortgage
$256,500
Interest Rate
3.6%
Purchase Details
Closed on
Mar 23, 2001
Sold by
Steven Marlin Grant Homes Inc
Bought by
Nordness Dean and Nordness Joelle
Purchase Details
Closed on
Jun 19, 2000
Sold by
Gamayuno Andrey and Gamayuno Tatyana
Bought by
Stevens Marlin Grant Homes Inc
Purchase Details
Closed on
Apr 20, 1998
Sold by
Yang Doua Pao and Yang Sia Cha
Bought by
Gamayunov Tatyana
Purchase Details
Closed on
Aug 8, 1996
Sold by
Knutson Clarence
Bought by
Yang Dua P and Yang Sia
Create a Home Valuation Report for This Property
The Home Valuation Report is an in-depth analysis detailing your home's value as well as a comparison with similar homes in the area
Home Values in the Area
Average Home Value in this Area
Purchase History
| Date | Buyer | Sale Price | Title Company |
|---|---|---|---|
| Stiles Sandra Ann | -- | None Listed On Document | |
| Stiles John L | $270,000 | Multiple | |
| Nordness Dean | $162,000 | -- | |
| Stevens Marlin Grant Homes Inc | $35,900 | -- | |
| Gamayunov Tatyana | $9,000 | -- | |
| Yang Dua P | $86,500 | -- |
Source: Public Records
Mortgage History
| Date | Status | Borrower | Loan Amount |
|---|---|---|---|
| Previous Owner | Stiles John L | $256,500 |
Source: Public Records
Tax History Compared to Growth
Tax History
| Year | Tax Paid | Tax Assessment Tax Assessment Total Assessment is a certain percentage of the fair market value that is determined by local assessors to be the total taxable value of land and additions on the property. | Land | Improvement |
|---|---|---|---|---|
| 2024 | $4,832 | $311,900 | $66,000 | $245,900 |
| 2023 | $4,663 | $306,700 | $54,000 | $252,700 |
| 2022 | $3,997 | $316,000 | $76,000 | $240,000 |
| 2021 | $4,324 | $271,000 | $63,000 | $208,000 |
| 2020 | $3,928 | $256,000 | $56,000 | $200,000 |
| 2019 | $4,302 | $233,000 | $50,000 | $183,000 |
| 2018 | $3,713 | $242,000 | $49,000 | $193,000 |
| 2017 | $3,031 | $189,000 | $35,000 | $154,000 |
| 2016 | $3,375 | $189,600 | $40,000 | $149,600 |
| 2015 | $2,584 | $156,500 | $35,900 | $120,600 |
| 2014 | -- | $128,000 | $34,400 | $93,600 |
Source: Public Records
Map
Nearby Homes
- 5557 Logan Ave N
- 5524 Humboldt Ave N
- 5307 Newton Ave N
- 5344 Girard Ave N
- 5239 Humboldt Ave N
- 5527 Fremont Ave N
- 5146 Newton Ave N
- 5135 Irving Ave N
- 5252 Queen Ave N
- 5118 James Ave N
- 5253 Queen Ave N
- 5706 Girard Ave N
- 5136 Queen Ave N
- 5715 Emerson Ave N
- 5101 Fremont Ave N
- 5842 James Ave N
- 5500 Bryant Ave N
- 5122 Sheridan Ave N
- 5637 Bryant Ave N
- 5030 Russell Ave N
- 5433 Knox Ave N
- 5421 Knox Ave N
- 5424 Logan Ave N
- 5430 Logan Ave N
- 5439 Knox Ave N
- 5415 Knox Ave N
- 5418 Logan Ave N
- 5436 Logan Ave N
- 5426 Knox Ave N
- 5432 Knox Ave N
- 5412 Logan Ave N
- 5420 Knox Ave N
- 5445 Knox Ave N
- 5407 Knox Ave N
- 5438 Knox Ave N
- 1821 55th Ave N
- 5414 Knox Ave N
- 5406 Logan Ave N
- 5444 Knox Ave N
- 5403 Knox Ave N