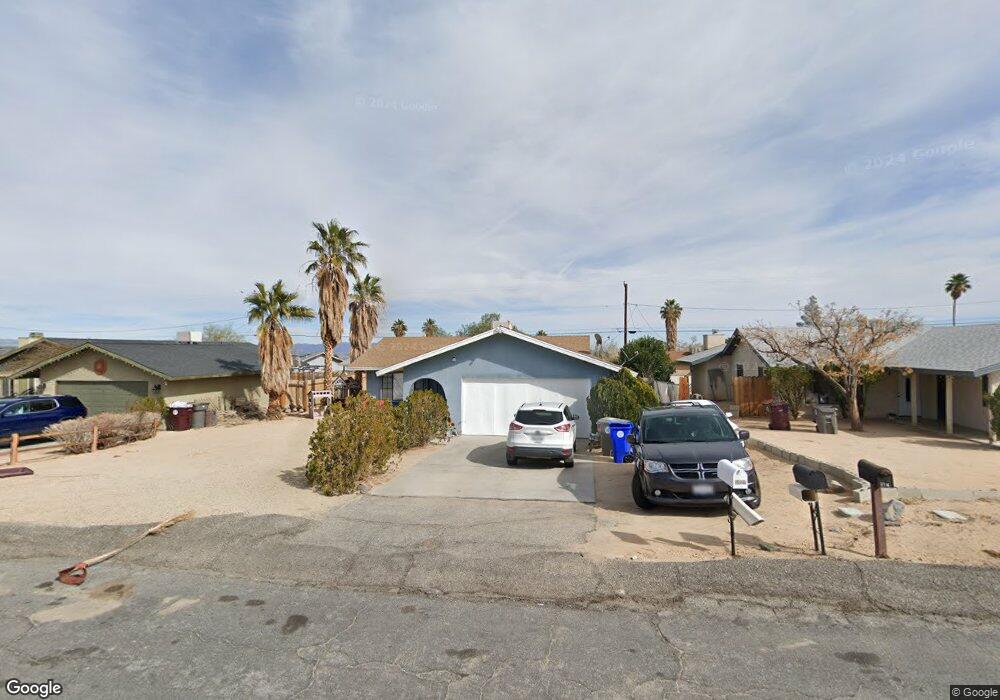
5427 Lupine Ave Twentynine Palms, CA 92277
Estimated Value: $232,369 - $253,000
2
Beds
1
Bath
1,264
Sq Ft
$193/Sq Ft
Est. Value
About This Home
This home is located at 5427 Lupine Ave, Twentynine Palms, CA 92277 and is currently estimated at $243,842, approximately $192 per square foot. 5427 Lupine Ave is a home located in San Bernardino County with nearby schools including Oasis Elementary School, Twentynine Palms Junior High School, and Twentynine Palms High School.
Ownership History
Date
Name
Owned For
Owner Type
Purchase Details
Closed on
Mar 3, 2009
Sold by
Wells Fargo Bank National Association
Bought by
Bodani Adam J and Bodani Princess M
Current Estimated Value
Home Financials for this Owner
Home Financials are based on the most recent Mortgage that was taken out on this home.
Original Mortgage
$95,816
Outstanding Balance
$60,699
Interest Rate
5.06%
Mortgage Type
VA
Estimated Equity
$183,143
Purchase Details
Closed on
Sep 5, 2008
Sold by
Clover Yolanda
Bought by
Wells Fargo Bank Na and Morgan Stanley Abs 1 Inc 2005-Wmc2
Purchase Details
Closed on
Jan 12, 2004
Sold by
Depierro Jim
Bought by
Clover Yolanda
Home Financials for this Owner
Home Financials are based on the most recent Mortgage that was taken out on this home.
Original Mortgage
$60,800
Interest Rate
7.1%
Mortgage Type
Purchase Money Mortgage
Create a Home Valuation Report for This Property
The Home Valuation Report is an in-depth analysis detailing your home's value as well as a comparison with similar homes in the area
Home Values in the Area
Average Home Value in this Area
Purchase History
| Date | Buyer | Sale Price | Title Company |
|---|---|---|---|
| Bodani Adam J | $94,000 | Landsafe Title San Bernardin | |
| Wells Fargo Bank Na | $90,378 | Landsafe | |
| Clover Yolanda | $64,000 | Fidelity National Title Co |
Source: Public Records
Mortgage History
| Date | Status | Borrower | Loan Amount |
|---|---|---|---|
| Open | Bodani Adam J | $95,816 | |
| Previous Owner | Clover Yolanda | $60,800 |
Source: Public Records
Tax History Compared to Growth
Tax History
| Year | Tax Paid | Tax Assessment Tax Assessment Total Assessment is a certain percentage of the fair market value that is determined by local assessors to be the total taxable value of land and additions on the property. | Land | Improvement |
|---|---|---|---|---|
| 2025 | $1,772 | $120,793 | $38,634 | $82,159 |
| 2024 | $1,772 | $118,424 | $37,876 | $80,548 |
| 2023 | $1,706 | $116,102 | $37,133 | $78,969 |
| 2022 | $1,667 | $113,826 | $36,405 | $77,421 |
| 2021 | $1,647 | $111,594 | $35,691 | $75,903 |
| 2020 | $1,628 | $110,450 | $35,325 | $75,125 |
| 2019 | $1,582 | $108,284 | $34,632 | $73,652 |
| 2018 | $1,545 | $106,161 | $33,953 | $72,208 |
| 2017 | $1,525 | $104,079 | $33,287 | $70,792 |
| 2016 | $1,498 | $102,038 | $32,634 | $69,404 |
| 2015 | $1,401 | $100,505 | $32,144 | $68,361 |
| 2014 | $1,393 | $98,536 | $31,514 | $67,022 |
Source: Public Records
Map
Nearby Homes
- 5363 Cahuilla Ave
- 5441 Abronia Ave
- 5491 Cahuilla Ave
- 72017 Siesta Dr
- 5374 Morongo Rd
- 5525 Lupine Ave
- 5536 Cahuilla Ave
- 71915 Samarkand Dr
- 5304 Morongo Rd
- 5333 Baileya Ave
- 5564 Mariposa Ave
- 5555 Mariposa Ave
- 5616 Cahuilla Ave
- 5580 Baileya Ave
- 5645 Cahuilla Ave
- 0 Mariposa Ave Unit OC23054133
- 72011 Two Mile Rd
- 1235 Daisy Ave
- 1234 Daisy Ave
- 1 Todd Ln
- 5439 Lupine Ave
- 5415 Lupine Ave
- 5405 Lupine Ave
- 5443 Lupine Ave
- 5430 Cahuilla Ave
- 5414 Cahuilla Ave
- 38 Lupine Ave
- 29 Lupine Ave
- 1 Lupine Ave
- 5440 Cahuilla Ave
- 5404 Cahuilla Ave
- 5455 Lupine Ave
- 5393 Lupine Ave
- 5428 Lupine Ave
- 5416 Lupine Ave
- 5434 Lupine Ave
- 5446 Lupine Ave
- 5442 Cahuilla Ave
- 5396 Cahuilla Ave
- 5467 Lupine Ave