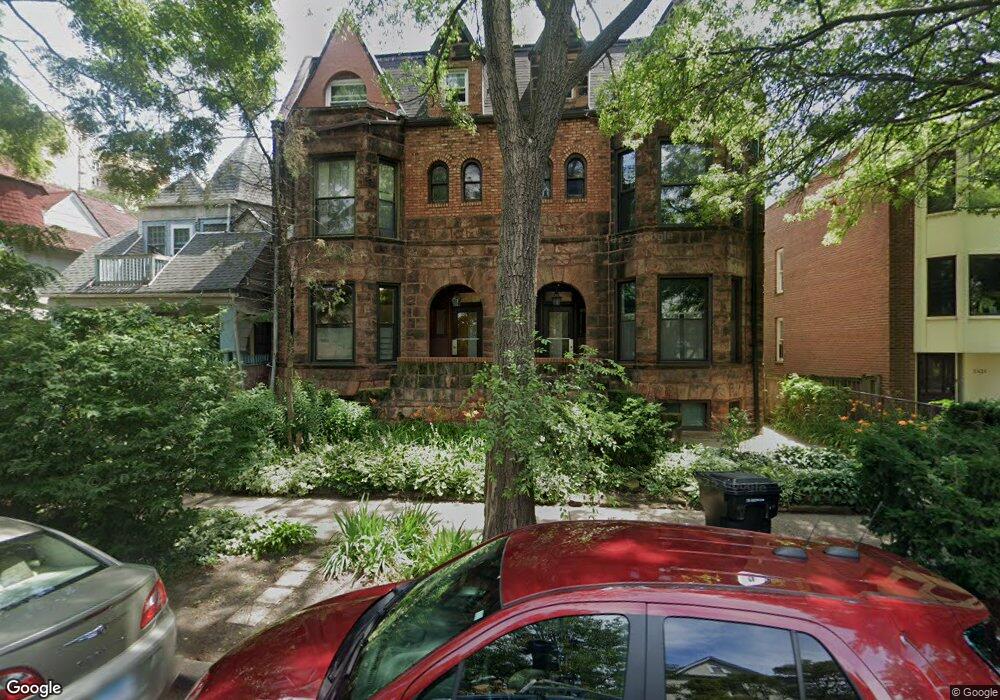
5427 S Blackstone Ave Unit 2 Chicago, IL 60615
Hyde Park NeighborhoodEstimated Value: $196,000 - $450,000
3
Beds
2
Baths
1,800
Sq Ft
$196/Sq Ft
Est. Value
About This Home
This home is located at 5427 S Blackstone Ave Unit 2, Chicago, IL 60615 and is currently estimated at $353,116, approximately $196 per square foot. 5427 S Blackstone Ave Unit 2 is a home located in Cook County with nearby schools including Ray Elementary School, Kenwood Academy High School, and Akiba-Schechter Jewish Day School.
Ownership History
Date
Name
Owned For
Owner Type
Purchase Details
Closed on
Jul 2, 2003
Sold by
Kogan Joseph and Kogan Yuliya
Bought by
Kogan Joseph and Kogan Yuliya
Current Estimated Value
Home Financials for this Owner
Home Financials are based on the most recent Mortgage that was taken out on this home.
Original Mortgage
$138,800
Outstanding Balance
$56,161
Interest Rate
4.62%
Mortgage Type
Unknown
Estimated Equity
$296,955
Purchase Details
Closed on
Sep 30, 1999
Sold by
Randall Arnold L and Randall Kirsten D
Bought by
Kogan Joseph
Home Financials for this Owner
Home Financials are based on the most recent Mortgage that was taken out on this home.
Original Mortgage
$141,550
Interest Rate
7.87%
Purchase Details
Closed on
May 15, 1995
Sold by
Thomas Joseph H and Thomas Joseph H
Bought by
Levin Kirsten D and Randall Arnold L
Home Financials for this Owner
Home Financials are based on the most recent Mortgage that was taken out on this home.
Original Mortgage
$101,650
Interest Rate
7.62%
Create a Home Valuation Report for This Property
The Home Valuation Report is an in-depth analysis detailing your home's value as well as a comparison with similar homes in the area
Home Values in the Area
Average Home Value in this Area
Purchase History
| Date | Buyer | Sale Price | Title Company |
|---|---|---|---|
| Kogan Joseph | -- | First American Title Ins Co | |
| Kogan Joseph | $149,000 | Professional National Title | |
| Levin Kirsten D | $107,000 | -- |
Source: Public Records
Mortgage History
| Date | Status | Borrower | Loan Amount |
|---|---|---|---|
| Open | Kogan Joseph | $138,800 | |
| Closed | Kogan Joseph | $141,550 | |
| Previous Owner | Levin Kirsten D | $101,650 |
Source: Public Records
Tax History Compared to Growth
Tax History
| Year | Tax Paid | Tax Assessment Tax Assessment Total Assessment is a certain percentage of the fair market value that is determined by local assessors to be the total taxable value of land and additions on the property. | Land | Improvement |
|---|---|---|---|---|
| 2024 | $5,724 | $45,420 | $13,950 | $31,470 |
| 2023 | $5,521 | $33,000 | $11,250 | $21,750 |
| 2022 | $5,521 | $33,000 | $11,250 | $21,750 |
| 2021 | $5,431 | $33,000 | $11,250 | $21,750 |
| 2020 | $5,253 | $29,163 | $9,000 | $20,163 |
| 2019 | $5,140 | $31,758 | $9,000 | $22,758 |
| 2018 | $3,127 | $31,758 | $9,000 | $22,758 |
| 2017 | $3,348 | $21,629 | $7,425 | $14,204 |
| 2016 | $3,475 | $21,629 | $7,425 | $14,204 |
| 2015 | $3,139 | $21,629 | $7,425 | $14,204 |
| 2014 | $2,676 | $18,828 | $6,075 | $12,753 |
| 2013 | $2,605 | $18,828 | $6,075 | $12,753 |
Source: Public Records
Map
Nearby Homes
- 5400 S Harper Ave Unit 1401
- 1438 E 55th St
- 1412 E Rochdale Place
- 1401 E 55th St Unit 602
- 1401 E 55th St Unit 815N
- 1451 E 55th St Unit 1030N
- 1450 E 55th Place Unit 317S
- 1400 E 55th Place Unit 702S
- 5315 S Harper Ave Unit 2
- 1452 E Park Place
- 1404 E 56th St Unit 1
- 5408 S Kimbark Ave
- 5616 S Harper Ave
- 5502 S Hyde Park Blvd Unit 1
- 5611 S Kenwood Ave
- 5471 S Hyde Park Blvd Unit 10A
- 5471 S Hyde Park Blvd Unit 16AB
- 1302 E 56th St Unit 3
- 5401 S Hyde Park Blvd Unit 1202
- 1213 E 53rd St Unit 3W
- 5427 S Blackstone Ave Unit 1
- 5429 S Blackstone Ave Unit 4
- 5429 S Blackstone Ave Unit 3
- 5429 S Blackstone Ave Unit Condo
- 5429 S Blackstone Ave
- 5425 S Blackstone Ave
- 5431 S Blackstone Ave
- 5423 S Blackstone Ave
- 5433 S Blackstone Ave
- 5417 S Blackstone Ave
- 1446 E 54th Place
- 5435 S Blackstone Ave
- 1452 E 54th Place
- 5437 S Blackstone Ave
- 5413 S Blackstone Ave
- 5430 S Harper Ave
- 5430 S Harper Ave Unit 1
- 5428 S Harper Ave
- 5426 S Harper Ave
- 5438 S Harper Ave