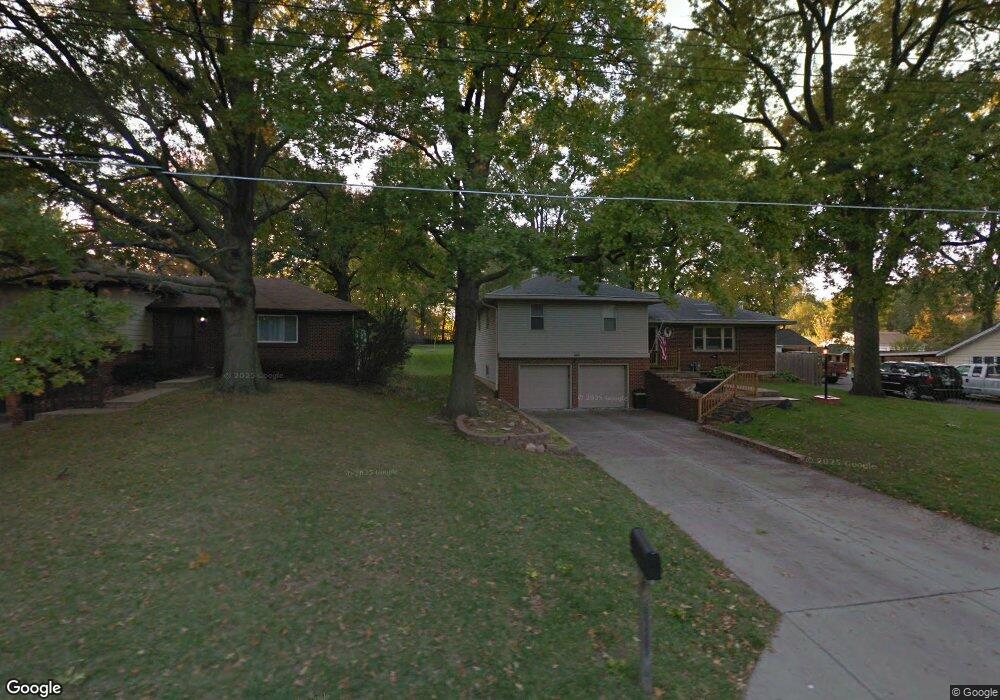
5428 Farley Ln Shawnee, KS 66203
Estimated Value: $336,322 - $345,000
3
Beds
2
Baths
1,520
Sq Ft
$224/Sq Ft
Est. Value
About This Home
This home is located at 5428 Farley Ln, Shawnee, KS 66203 and is currently estimated at $340,831, approximately $224 per square foot. 5428 Farley Ln is a home located in Johnson County with nearby schools including Merriam Park Elementary School, Hocker Grove Middle School, and Shawnee Mission North High School.
Ownership History
Date
Name
Owned For
Owner Type
Purchase Details
Closed on
Aug 1, 2018
Sold by
Viers Thelma J
Bought by
Isenmann Sage T and Isenmann Melanie C
Current Estimated Value
Home Financials for this Owner
Home Financials are based on the most recent Mortgage that was taken out on this home.
Original Mortgage
$160,000
Outstanding Balance
$138,373
Interest Rate
4.5%
Mortgage Type
New Conventional
Estimated Equity
$202,458
Purchase Details
Closed on
May 21, 2009
Sold by
Viers Thelma Jean and Wilczek Misty L
Bought by
Viers Thelma J
Home Financials for this Owner
Home Financials are based on the most recent Mortgage that was taken out on this home.
Original Mortgage
$56,200
Interest Rate
4.76%
Mortgage Type
New Conventional
Purchase Details
Closed on
Jan 23, 2003
Sold by
Viers Thelma Jean
Bought by
Viers Thelma Jean and Wilczek Misty L
Create a Home Valuation Report for This Property
The Home Valuation Report is an in-depth analysis detailing your home's value as well as a comparison with similar homes in the area
Home Values in the Area
Average Home Value in this Area
Purchase History
| Date | Buyer | Sale Price | Title Company |
|---|---|---|---|
| Isenmann Sage T | -- | Kansas City Title Inc | |
| Viers Thelma J | -- | Chicago Title Ins Co | |
| Viers Thelma Jean | -- | -- |
Source: Public Records
Mortgage History
| Date | Status | Borrower | Loan Amount |
|---|---|---|---|
| Open | Isenmann Sage T | $160,000 | |
| Previous Owner | Viers Thelma J | $56,200 |
Source: Public Records
Tax History Compared to Growth
Tax History
| Year | Tax Paid | Tax Assessment Tax Assessment Total Assessment is a certain percentage of the fair market value that is determined by local assessors to be the total taxable value of land and additions on the property. | Land | Improvement |
|---|---|---|---|---|
| 2024 | $3,555 | $33,350 | $5,477 | $27,873 |
| 2023 | $3,384 | $32,303 | $5,477 | $26,826 |
| 2022 | $3,413 | $31,360 | $4,976 | $26,384 |
| 2021 | $3,413 | $25,875 | $4,516 | $21,359 |
| 2020 | $2,654 | $23,196 | $3,931 | $19,265 |
| 2019 | $2,502 | $21,862 | $3,418 | $18,444 |
| 2018 | $2,371 | $20,643 | $3,104 | $17,539 |
| 2017 | $2,161 | $18,584 | $3,104 | $15,480 |
| 2016 | $1,994 | $16,974 | $3,104 | $13,870 |
| 2015 | $1,921 | $16,491 | $3,104 | $13,387 |
| 2013 | -- | $15,399 | $3,104 | $12,295 |
Source: Public Records
Map
Nearby Homes
- 9719 W 53rd St
- 10116 W 52nd Terrace
- 5517 Hayes St
- The Fleetwood Plan at Bristol Highlands - The Villas
- The Fleetwood Plan at Bristol Highlands - The Manors
- The Kirkwood Plan at Bristol Highlands - The Villas
- 8013 Payne St
- The Rockwood Plan at Bristol Highlands - The Villas
- 5220 Hayes St
- 9328 W 51st St
- 5003 Knox Ave
- 11002 W 55th Terrace
- 10511 W 49th Place
- 0 W 49th St
- 8613 W 54th Terrace
- 5308 Mcanany Dr
- 9201 W 48th Terrace
- 9012 W 49th St
- 11403 W 51st Terrace
- 5405 Oliver St
- 5432 Farley Ln
- 5424 Farley Ln
- 5436 Farley Ln
- 5410 Farley Ln
- 5427 Farley Ln
- 5425 Farley Ln
- 5438 Farley Ln
- 5402 Farley Ln
- 10022 W 55th St
- 9824 W 55th St
- 5415 Farley Ln
- 10024 W 55th St
- 5400 Farley Ln
- 9820 W 55th St
- 5409 Farley Ln
- 9907 W 55th St
- 9901 W 55th St
- 9909 W 55th St
- 9816 W 55th St
- 10023 W 55th St