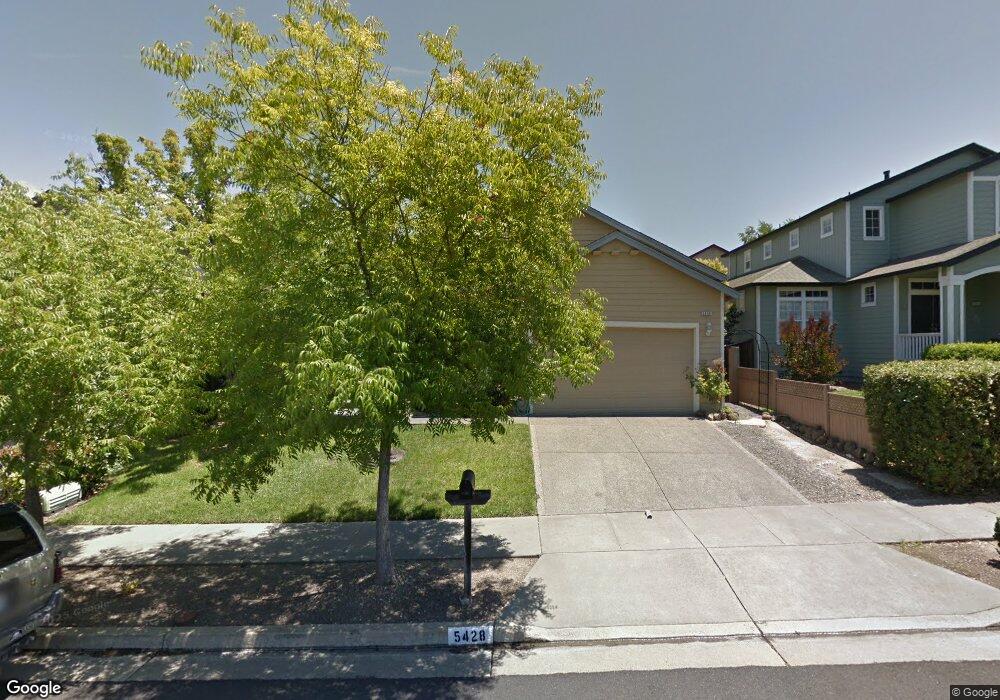
5428 Sharon St Santa Rosa, CA 95409
Skyhawk NeighborhoodEstimated Value: $850,046 - $933,000
4
Beds
2
Baths
2,134
Sq Ft
$419/Sq Ft
Est. Value
About This Home
This home is located at 5428 Sharon St, Santa Rosa, CA 95409 and is currently estimated at $893,512, approximately $418 per square foot. 5428 Sharon St is a home located in Sonoma County with nearby schools including Austin Creek Elementary School, Rincon Valley Middle School, and Maria Carrillo High School.
Ownership History
Date
Name
Owned For
Owner Type
Purchase Details
Closed on
Oct 10, 2024
Sold by
Yang Sai and Luo Hong
Bought by
Sai Yang And Hong Luo Living Trust and Yang
Current Estimated Value
Purchase Details
Closed on
Mar 22, 2011
Sold by
Cervantes Carmen T and Carmen Trust
Bought by
Yang Sai and Luo Hong
Home Financials for this Owner
Home Financials are based on the most recent Mortgage that was taken out on this home.
Original Mortgage
$397,600
Interest Rate
5.02%
Mortgage Type
New Conventional
Purchase Details
Closed on
Jun 28, 2006
Sold by
Cervantes Carmen Teresa
Bought by
Cervantes Carmen T and Carmen T Cervantes Trust
Home Financials for this Owner
Home Financials are based on the most recent Mortgage that was taken out on this home.
Original Mortgage
$564,750
Interest Rate
6.63%
Mortgage Type
New Conventional
Purchase Details
Closed on
May 17, 2005
Sold by
Cervantes Carmen
Bought by
Cervantes Carmen T and The Carmen T Cervantes Trust
Home Financials for this Owner
Home Financials are based on the most recent Mortgage that was taken out on this home.
Original Mortgage
$556,500
Interest Rate
5.87%
Mortgage Type
Stand Alone First
Purchase Details
Closed on
May 10, 2005
Sold by
Wong Barry and Wong Jennifer
Bought by
Cervantes Carmen T
Home Financials for this Owner
Home Financials are based on the most recent Mortgage that was taken out on this home.
Original Mortgage
$556,500
Interest Rate
5.87%
Mortgage Type
Stand Alone First
Purchase Details
Closed on
May 14, 2001
Sold by
Ramsay Cathy W
Bought by
Wong Barry and Wong Jennifer
Home Financials for this Owner
Home Financials are based on the most recent Mortgage that was taken out on this home.
Original Mortgage
$380,800
Interest Rate
6.62%
Purchase Details
Closed on
Dec 13, 2000
Sold by
Ramsay Stephen G
Bought by
Ramsay Cathy W
Purchase Details
Closed on
Mar 9, 1999
Sold by
P C Development Lp
Bought by
Ramsay Stephen G and Ramsay Cathy W
Home Financials for this Owner
Home Financials are based on the most recent Mortgage that was taken out on this home.
Original Mortgage
$190,000
Interest Rate
6.7%
Purchase Details
Closed on
Mar 5, 1999
Sold by
Nave James A and Nave Sheila F
Bought by
P C Development Lp
Home Financials for this Owner
Home Financials are based on the most recent Mortgage that was taken out on this home.
Original Mortgage
$190,000
Interest Rate
6.7%
Purchase Details
Closed on
Sep 15, 1997
Sold by
P C Development Lp
Bought by
Nave James A and Nave Sheila F
Create a Home Valuation Report for This Property
The Home Valuation Report is an in-depth analysis detailing your home's value as well as a comparison with similar homes in the area
Home Values in the Area
Average Home Value in this Area
Purchase History
| Date | Buyer | Sale Price | Title Company |
|---|---|---|---|
| Sai Yang And Hong Luo Living Trust | -- | None Listed On Document | |
| Yang Sai | $497,000 | First American Title Company | |
| Cervantes Carmen T | -- | First American Title Company | |
| Cervantes Carmen Teresa | -- | First American Title Company | |
| Cervantes Carmen T | -- | -- | |
| Cervantes Carmen T | $742,000 | Chicago Title Co | |
| Wong Barry | $476,000 | North American Title Co | |
| Ramsay Cathy W | -- | -- | |
| Ramsay Stephen G | $316,000 | North Bay Title Co | |
| P C Development Lp | $250,500 | North American Title Co | |
| Nave James A | $751,500 | North American Title Co |
Source: Public Records
Mortgage History
| Date | Status | Borrower | Loan Amount |
|---|---|---|---|
| Previous Owner | Yang Sai | $397,600 | |
| Previous Owner | Cervantes Carmen Teresa | $564,750 | |
| Previous Owner | Cervantes Carmen T | $556,500 | |
| Previous Owner | Wong Barry | $380,800 | |
| Previous Owner | Ramsay Stephen G | $190,000 |
Source: Public Records
Tax History Compared to Growth
Tax History
| Year | Tax Paid | Tax Assessment Tax Assessment Total Assessment is a certain percentage of the fair market value that is determined by local assessors to be the total taxable value of land and additions on the property. | Land | Improvement |
|---|---|---|---|---|
| 2025 | $7,400 | $636,732 | $160,142 | $476,590 |
| 2024 | $7,400 | $624,248 | $157,002 | $467,246 |
| 2023 | $7,400 | $612,009 | $153,924 | $458,085 |
| 2022 | $6,834 | $600,009 | $150,906 | $449,103 |
| 2021 | $6,700 | $588,246 | $147,948 | $440,298 |
| 2020 | $6,676 | $582,215 | $146,431 | $435,784 |
| 2019 | $6,615 | $570,800 | $143,560 | $427,240 |
| 2018 | $6,577 | $559,609 | $140,746 | $418,863 |
| 2017 | $6,458 | $548,637 | $137,987 | $410,650 |
| 2016 | $6,394 | $537,881 | $135,282 | $402,599 |
| 2015 | $6,203 | $529,802 | $133,250 | $396,552 |
| 2014 | $5,749 | $499,000 | $126,000 | $373,000 |
Source: Public Records
Map
Nearby Homes
- 5388 Sonoma Hwy
- 5682 Raters Dr
- 184 El Encanto Way
- 5534 Rainbow Cir
- 5426 Spring Lake Ct
- 5088 Firestone Ct
- 5644 Eastlake Dr
- 5741 Evening Way
- 5518 Marit Dr
- 5056 Fravel Ln
- 5482 Pepperwood Rd
- 5086 Charmian Dr
- 5794 Owl Hill Ave
- 5550 Pepperwood Rd
- 5569 Pepperwood Rd
- 206 Indian Creek Dr
- 305 Simone Place N
- 5020 Roma St
- 5860 Melita Rd
- 5015 Charmian Dr
- 5424 Sharon St
- 5432 Sharon St
- 5464 Diane Way
- 5460 Diane Way
- 5468 Diane Way
- 5420 Sharon St
- 5408 Hazelwood Ct
- 5459 Pine Hill Ct
- 5472 Diane Way
- 5416 Sharon St
- 5416 Hazelwood Ct
- 5476 Diane Way
- 5455 Pine Hill Ct
- 5412 Sharon St
- 5463 Diane Way
- 5459 Diane Way
- 5467 Diane Way
- 5460 Pine Hill Ct
- 5480 Diane Way
- 5471 Diane Way