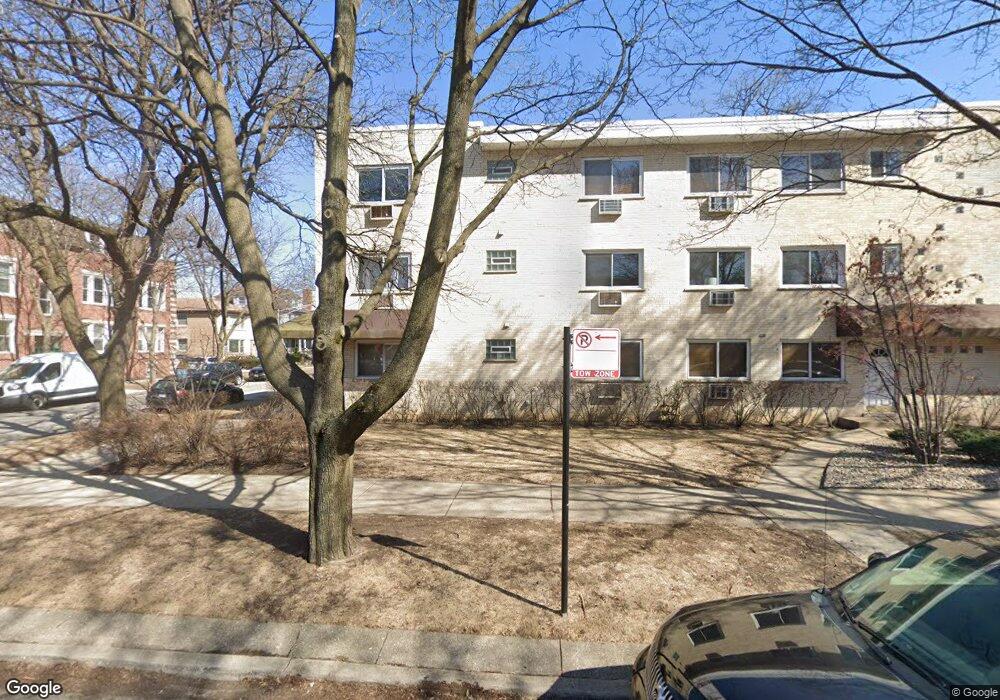
5429 N Paulina St Unit 1S Chicago, IL 60640
Andersonville NeighborhoodEstimated Value: $229,000 - $300,000
--
Bed
1
Bath
--
Sq Ft
9,845
Sq Ft Lot
About This Home
This home is located at 5429 N Paulina St Unit 1S, Chicago, IL 60640 and is currently estimated at $264,121. 5429 N Paulina St Unit 1S is a home located in Cook County with nearby schools including Chappell Elementary School, Amundsen High School, and Passages Elementary Charter School.
Ownership History
Date
Name
Owned For
Owner Type
Purchase Details
Closed on
Feb 14, 2023
Sold by
Sheets Erin K
Bought by
Lugo Ronald and Silver David
Current Estimated Value
Home Financials for this Owner
Home Financials are based on the most recent Mortgage that was taken out on this home.
Original Mortgage
$185,250
Outstanding Balance
$179,490
Interest Rate
6.38%
Mortgage Type
New Conventional
Estimated Equity
$84,631
Purchase Details
Closed on
Aug 7, 2001
Sold by
Shelton Jennifer L
Bought by
Sheets Erin K
Home Financials for this Owner
Home Financials are based on the most recent Mortgage that was taken out on this home.
Original Mortgage
$116,800
Interest Rate
7.03%
Mortgage Type
Purchase Money Mortgage
Purchase Details
Closed on
Apr 20, 1999
Sold by
Firstar Bank Illinois
Bought by
Shelton Jennifer L
Home Financials for this Owner
Home Financials are based on the most recent Mortgage that was taken out on this home.
Original Mortgage
$92,000
Interest Rate
6.99%
Mortgage Type
Purchase Money Mortgage
Create a Home Valuation Report for This Property
The Home Valuation Report is an in-depth analysis detailing your home's value as well as a comparison with similar homes in the area
Home Values in the Area
Average Home Value in this Area
Purchase History
| Date | Buyer | Sale Price | Title Company |
|---|---|---|---|
| Lugo Ronald | $195,000 | Proper Title | |
| Sheets Erin K | $146,000 | -- | |
| Shelton Jennifer L | $104,000 | -- |
Source: Public Records
Mortgage History
| Date | Status | Borrower | Loan Amount |
|---|---|---|---|
| Open | Lugo Ronald | $185,250 | |
| Previous Owner | Sheets Erin K | $116,800 | |
| Previous Owner | Shelton Jennifer L | $92,000 |
Source: Public Records
Tax History Compared to Growth
Tax History
| Year | Tax Paid | Tax Assessment Tax Assessment Total Assessment is a certain percentage of the fair market value that is determined by local assessors to be the total taxable value of land and additions on the property. | Land | Improvement |
|---|---|---|---|---|
| 2024 | $2,887 | $19,977 | $8,322 | $11,655 |
| 2023 | $2,793 | $17,000 | $6,691 | $10,309 |
| 2022 | $2,793 | $17,000 | $6,691 | $10,309 |
| 2021 | $2,749 | $16,999 | $6,690 | $10,309 |
| 2020 | $2,953 | $16,360 | $3,847 | $12,513 |
| 2019 | $2,948 | $18,102 | $3,847 | $14,255 |
| 2018 | $2,897 | $18,102 | $3,847 | $14,255 |
| 2017 | $1,604 | $10,828 | $3,345 | $7,483 |
| 2016 | $1,669 | $10,828 | $3,345 | $7,483 |
| 2015 | $1,504 | $10,828 | $3,345 | $7,483 |
| 2014 | $1,835 | $12,460 | $2,550 | $9,910 |
| 2013 | $1,788 | $12,460 | $2,550 | $9,910 |
Source: Public Records
Map
Nearby Homes
- 1621 W Rascher Ave Unit G
- 1704 W Catalpa Ave Unit 2W
- 5338 N Ashland Ave
- 5607 N Clark St Unit 2
- 1458 W Berwyn Ave Unit 1
- 1740 W Foster Ave Unit 3F
- 1740 W Foster Ave Unit 3R
- 1824 W Farragut Ave
- 1443 W Summerdale Ave
- 1415 W Catalpa Ave Unit 1N
- 1719 W Foster Ave
- 1910 W Farragut Ave
- 1824 W Foster Ave Unit 302
- 5306 N Glenwood Ave Unit 2A
- 5217 N Winchester Ave Unit 1S
- 1527 W Edgewater Ave
- 1416 W Olive Ave Unit 2
- 5611 N Glenwood Ave Unit G
- 1968 W Foster Ave Unit D
- 5049 N Ashland Ave
- 5429 N Paulina St Unit 1647-6
- 5429 N Paulina St Unit P-1
- 5429 N Paulina St Unit 5425-6
- 5429 N Paulina St Unit 1647-5
- 5429 N Paulina St Unit 1647-2
- 5429 N Paulina St Unit 5425-1
- 5429 N Paulina St Unit 5425-4
- 5429 N Paulina St Unit P-3
- 5429 N Paulina St Unit P-6
- 5429 N Paulina St Unit P-8
- 5429 N Paulina St Unit P-9
- 5429 N Paulina St Unit P-4
- 5429 N Paulina St Unit 1647-1
- 1647 W Rascher Ave Unit 16473
- 1647 W Rascher Ave Unit 2P
- 1647 W Rascher Ave Unit P7
- 1647 W Rascher Ave Unit 16474
- 1647 W Rascher Ave Unit 1E
- 1647 W Rascher Ave Unit 2W
- 1647 W Rascher Ave Unit 3W