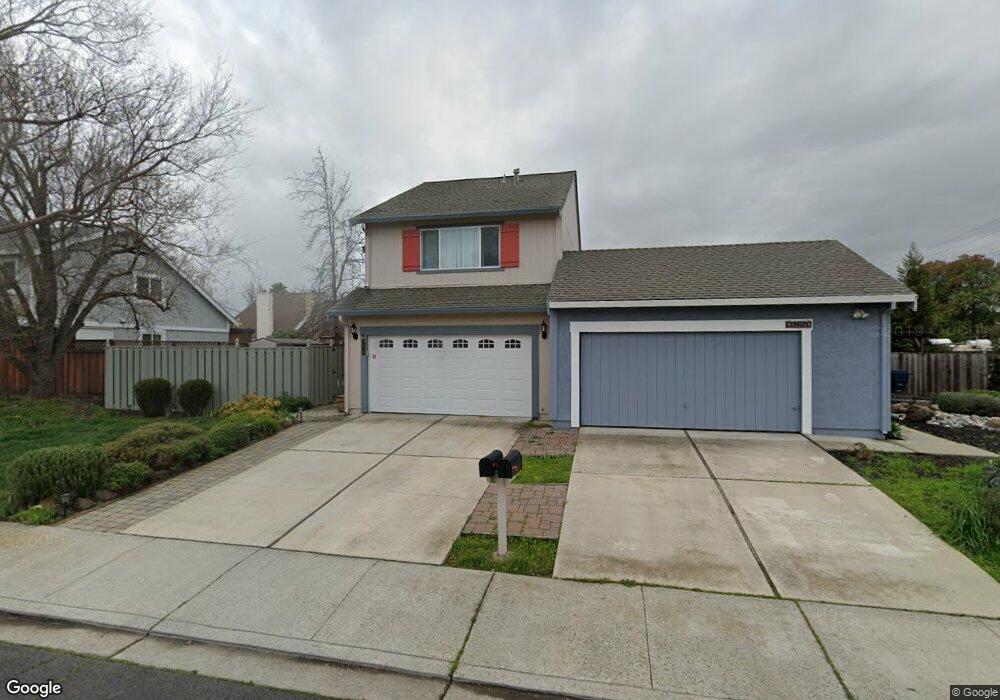
5429 Treeflower Dr Livermore, CA 94551
Springtown NeighborhoodEstimated Value: $881,999 - $1,005,000
3
Beds
3
Baths
1,389
Sq Ft
$667/Sq Ft
Est. Value
About This Home
This home is located at 5429 Treeflower Dr, Livermore, CA 94551 and is currently estimated at $926,750, approximately $667 per square foot. 5429 Treeflower Dr is a home located in Alameda County with nearby schools including Altamont Creek Elementary School, Andrew N. Christensen Middle School, and Livermore High School.
Ownership History
Date
Name
Owned For
Owner Type
Purchase Details
Closed on
Aug 24, 2018
Sold by
Mifsud William Paul and Mifsud Rosemarie
Bought by
Nagasubramanian Nagesh and Nagasubramanian Nagesh Gayathri
Current Estimated Value
Home Financials for this Owner
Home Financials are based on the most recent Mortgage that was taken out on this home.
Original Mortgage
$679,500
Outstanding Balance
$590,118
Interest Rate
4.5%
Mortgage Type
New Conventional
Estimated Equity
$336,632
Purchase Details
Closed on
Jun 1, 2005
Sold by
Khalil Tahir and Khalil Amna
Bought by
Mifsud William Paul and Mifsud Rosemarie
Home Financials for this Owner
Home Financials are based on the most recent Mortgage that was taken out on this home.
Original Mortgage
$432,000
Interest Rate
5.37%
Mortgage Type
New Conventional
Create a Home Valuation Report for This Property
The Home Valuation Report is an in-depth analysis detailing your home's value as well as a comparison with similar homes in the area
Home Values in the Area
Average Home Value in this Area
Purchase History
| Date | Buyer | Sale Price | Title Company |
|---|---|---|---|
| Nagasubramanian Nagesh | $724,000 | First American Title Company | |
| Mifsud William Paul | $540,000 | Ticor Title Company Of Ca |
Source: Public Records
Mortgage History
| Date | Status | Borrower | Loan Amount |
|---|---|---|---|
| Open | Nagasubramanian Nagesh | $679,500 | |
| Previous Owner | Mifsud William Paul | $432,000 |
Source: Public Records
Tax History
| Year | Tax Paid | Tax Assessment Tax Assessment Total Assessment is a certain percentage of the fair market value that is determined by local assessors to be the total taxable value of land and additions on the property. | Land | Improvement |
|---|---|---|---|---|
| 2025 | $10,127 | $807,063 | $242,119 | $564,944 |
| 2024 | $10,127 | $791,240 | $237,372 | $553,868 |
| 2023 | $9,982 | $775,728 | $232,718 | $543,010 |
| 2022 | $9,845 | $760,521 | $228,156 | $532,365 |
| 2021 | $9,650 | $745,610 | $223,683 | $521,927 |
| 2020 | $9,374 | $737,970 | $221,391 | $516,579 |
| 2019 | $9,418 | $723,500 | $217,050 | $506,450 |
| 2018 | $8,582 | $661,494 | $198,448 | $463,046 |
| 2017 | $6,861 | $520,000 | $156,000 | $364,000 |
| 2016 | $6,722 | $520,000 | $156,000 | $364,000 |
| 2015 | $5,736 | $460,000 | $138,000 | $322,000 |
| 2014 | $5,348 | $425,000 | $127,500 | $297,500 |
Source: Public Records
Map
Nearby Homes
- 1414 Columbine Way
- 5473 Rainflower Dr
- 1279 Marigold Rd
- 5741 Rainflower Dr
- 883 Barney Com
- 884 Sungold Cir Unit 123
- 1264 Tulip Way
- 5251 Peony Dr
- 1426 Jayhawk Ln
- 6506 Forget me Not
- 1817 Bluebell Dr
- 5833 Singing Hills Ave
- 7576 Southfront Rd
- 2060 Broadmoor St
- 5941 Crestmont Ave
- 4669 Golf Dr
- 1128 Larkspur Dr
- 6189 Fieldstone Dr
- 5637 Idlewild Ave
- 1031 Spring Valley Common
- 5431 Treeflower Dr
- 5417 Treeflower Dr
- 5356 Wisteria Way
- 5360 Wisteria Way
- 5331 Treeflower Dr
- 5362 Wisteria Way
- 5449 Treeflower Dr
- 5426 Treeflower Dr
- 5430 Treeflower Dr
- 5418 Treeflower Dr
- 5434 Treeflower Dr
- 5376 Wisteria Way
- 5414 Treeflower Dr
- 5380 Treeflower Dr
- 5446 Treeflower Dr
- 5388 Wisteria Way
- 5310 Treeflower Dr
- 5452 Treeflower Dr
- 5366 Treeflower Dr
- 5372 Treeflower Dr
Your Personal Tour Guide
Ask me questions while you tour the home.