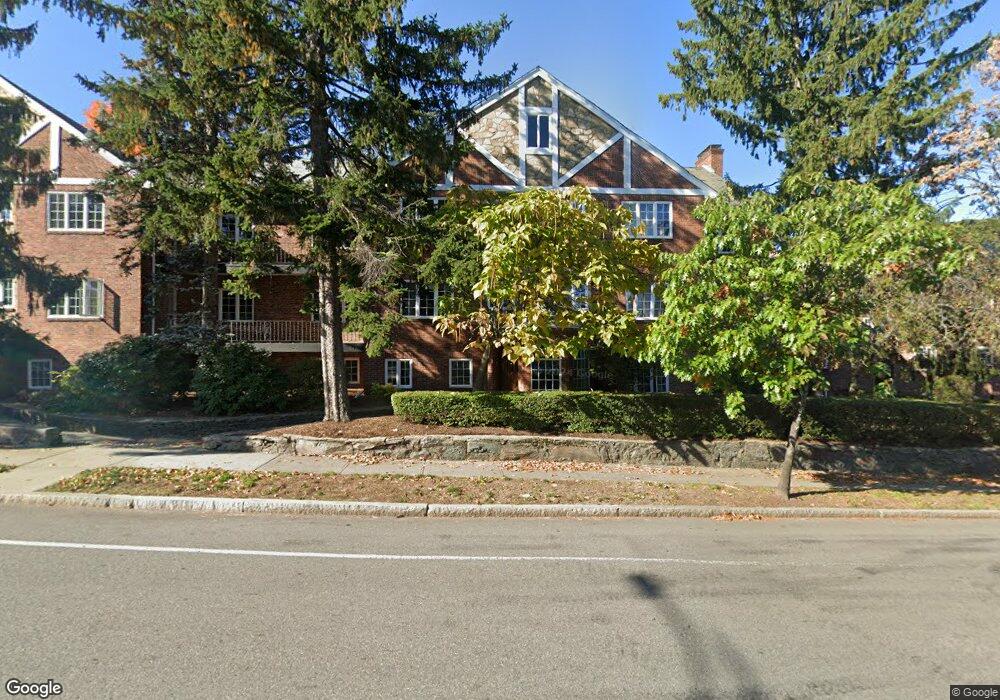
543 Centre St Unit 5 Newton, MA 02458
Newton Corner NeighborhoodEstimated Value: $480,686 - $522,000
1
Bed
1
Bath
706
Sq Ft
$712/Sq Ft
Est. Value
About This Home
This home is located at 543 Centre St Unit 5, Newton, MA 02458 and is currently estimated at $502,422, approximately $711 per square foot. 543 Centre St Unit 5 is a home located in Middlesex County with nearby schools including Underwood Elementary School, Bigelow Middle School, and Newton North High School.
Ownership History
Date
Name
Owned For
Owner Type
Purchase Details
Closed on
Oct 9, 2020
Sold by
Ozer Joyce I
Bought by
Costello Bernadette F
Current Estimated Value
Home Financials for this Owner
Home Financials are based on the most recent Mortgage that was taken out on this home.
Original Mortgage
$300,000
Outstanding Balance
$266,834
Interest Rate
2.9%
Mortgage Type
New Conventional
Estimated Equity
$235,588
Purchase Details
Closed on
Aug 1, 1997
Sold by
Shay Shannon H
Bought by
Ozer Joyce I
Home Financials for this Owner
Home Financials are based on the most recent Mortgage that was taken out on this home.
Original Mortgage
$110,250
Interest Rate
7.55%
Mortgage Type
Purchase Money Mortgage
Purchase Details
Closed on
Aug 9, 1991
Sold by
Forte Frances
Bought by
Shay Shannon H
Home Financials for this Owner
Home Financials are based on the most recent Mortgage that was taken out on this home.
Original Mortgage
$77,000
Interest Rate
9.58%
Mortgage Type
Purchase Money Mortgage
Create a Home Valuation Report for This Property
The Home Valuation Report is an in-depth analysis detailing your home's value as well as a comparison with similar homes in the area
Home Values in the Area
Average Home Value in this Area
Purchase History
| Date | Buyer | Sale Price | Title Company |
|---|---|---|---|
| Costello Bernadette F | $420,000 | None Available | |
| Ozer Joyce I | $122,500 | -- | |
| Shay Shannon H | $124,000 | -- |
Source: Public Records
Mortgage History
| Date | Status | Borrower | Loan Amount |
|---|---|---|---|
| Open | Costello Bernadette F | $300,000 | |
| Previous Owner | Shay Shannon H | $110,500 | |
| Previous Owner | Shay Shannon H | $110,250 | |
| Previous Owner | Shay Shannon H | $77,000 |
Source: Public Records
Tax History
| Year | Tax Paid | Tax Assessment Tax Assessment Total Assessment is a certain percentage of the fair market value that is determined by local assessors to be the total taxable value of land and additions on the property. | Land | Improvement |
|---|---|---|---|---|
| 2025 | $4,393 | $448,300 | $0 | $448,300 |
| 2024 | $4,248 | $435,200 | $0 | $435,200 |
| 2023 | $4,193 | $411,900 | $0 | $411,900 |
| 2022 | $4,127 | $392,300 | $0 | $392,300 |
| 2021 | $3,360 | $312,300 | $0 | $312,300 |
| 2020 | $3,260 | $312,300 | $0 | $312,300 |
| 2019 | $3,168 | $303,200 | $0 | $303,200 |
| 2018 | $3,170 | $293,000 | $0 | $293,000 |
| 2017 | $3,074 | $276,400 | $0 | $276,400 |
| 2016 | $2,939 | $258,300 | $0 | $258,300 |
| 2015 | $2,856 | $246,000 | $0 | $246,000 |
Source: Public Records
Map
Nearby Homes
- 549 Centre St Unit 2
- 327 Franklin St
- 97 Eldredge St
- 269 Franklin St
- 68 Vernon St
- 9 Baldwin St Unit 15C
- 35 George St Unit 35
- 37 George St Unit 37
- 33 George St Unit 33
- 59 Hyde Ave
- 34 Channing St Unit 2
- 0 Claremont St
- 123 Sargent St
- 65-67 Saint James Cir
- 159 Washington St Unit 4
- 180 Hunnewell Ave Unit 180
- 180 Hunnewell Ave Unit A
- 48-50 Carleton St
- 216 Newtonville Ave Unit 218
- 15 Farlow Rd
- 543 Centre St Unit 8
- 543 Centre St Unit 7
- 543 Centre St Unit 6
- 543 Centre St Unit 4
- 543 Centre St Unit 3
- 543 Centre St Unit 2
- 543 Centre St Unit 1
- 543 Centre St Unit 5,543
- 543 Centre St Unit 4, 543
- 543 Centre St Unit 2,543
- 549 Centre St Unit 8
- 549 Centre St Unit 7
- 549 Centre St Unit 6
- 549 Centre St Unit 5
- 549 Centre St Unit 4
- 549 Centre St Unit 1
- 549 Centre St
- 549 Centre St Unit 44
- 549 Centre St Unit 549, 3
- 549 Centre St Unit 3,549
Your Personal Tour Guide
Ask me questions while you tour the home.