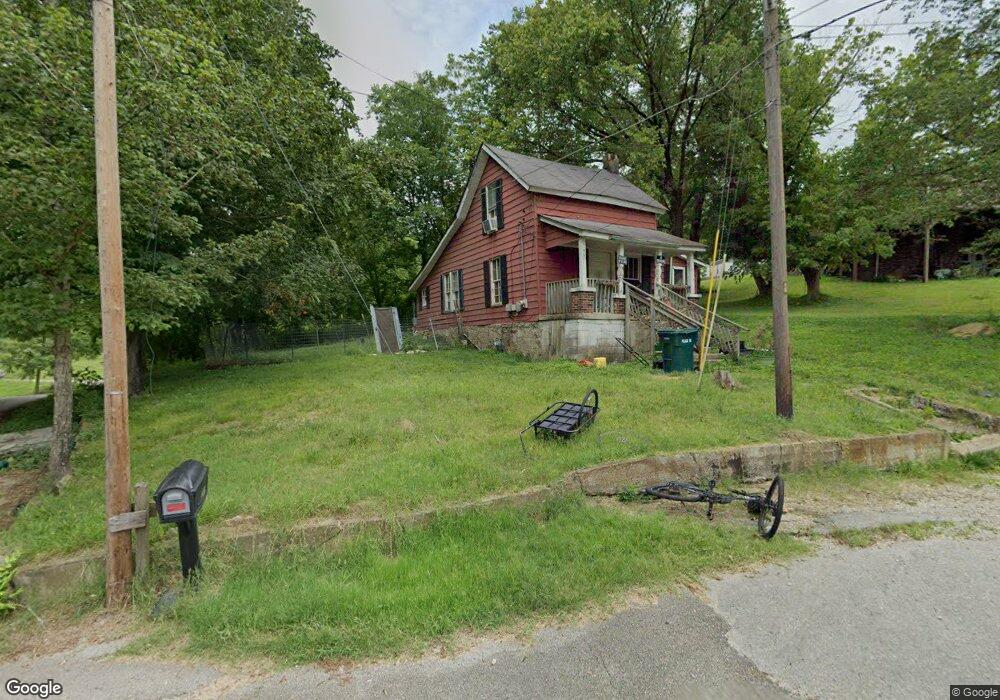
543 Cherry St Pulaski, TN 38478
Estimated Value: $56,000 - $178,000
Studio
1
Bath
900
Sq Ft
$118/Sq Ft
Est. Value
About This Home
This home is located at 543 Cherry St, Pulaski, TN 38478 and is currently estimated at $105,979, approximately $117 per square foot. 543 Cherry St is a home located in Giles County with nearby schools including Pulaski Elementary School, Southside Elementary School, and Bridgeforth Middle School.
Ownership History
Date
Name
Owned For
Owner Type
Purchase Details
Closed on
Jul 11, 2022
Sold by
Jim Bonner Development Llc
Bought by
Dewitt Brandy Nicole and Doolittle William Louis
Current Estimated Value
Purchase Details
Closed on
Feb 25, 2021
Sold by
Brooks Stanley P
Bought by
Hardin Shenita D
Purchase Details
Closed on
Feb 9, 2011
Bought by
Bonner Jim Devl Llc
Purchase Details
Closed on
Mar 6, 1997
Sold by
Massey Randy and Massey Minnie
Bought by
Dale David and Dale Derrick
Purchase Details
Closed on
Jan 31, 1997
Sold by
Perry Charles H
Bought by
Massey Randy and Massey Minnie
Purchase Details
Closed on
Aug 30, 1993
Bought by
Perry Charles H
Purchase Details
Closed on
Jun 14, 1993
Bought by
Mcneese Harvey H and Mcneese Jesse B
Purchase Details
Closed on
Jun 18, 1987
Bought by
Freedlander Inc
Create a Home Valuation Report for This Property
The Home Valuation Report is an in-depth analysis detailing your home's value as well as a comparison with similar homes in the area
Home Values in the Area
Average Home Value in this Area
Purchase History
| Date | Buyer | Sale Price | Title Company |
|---|---|---|---|
| Dewitt Brandy Nicole | $29,000 | Andrew Hoover & Attorneys Pc | |
| Hardin Shenita D | $4,500 | Giles Title And Escrow | |
| Bonner Jim Devl Llc | $28,800 | -- | |
| Dale David | $5,000 | -- | |
| Massey Randy | $3,000 | -- | |
| Perry Charles H | $6,000 | -- | |
| Mcneese Harvey H | -- | -- | |
| Freedlander Inc | -- | -- |
Source: Public Records
Tax History
| Year | Tax Paid | Tax Assessment Tax Assessment Total Assessment is a certain percentage of the fair market value that is determined by local assessors to be the total taxable value of land and additions on the property. | Land | Improvement |
|---|---|---|---|---|
| 2025 | $336 | $12,300 | $2,075 | $10,225 |
| 2024 | $296 | $12,300 | $2,075 | $10,225 |
| 2023 | $296 | $12,300 | $2,075 | $10,225 |
| 2022 | $296 | $12,300 | $2,075 | $10,225 |
| 2021 | $249 | $7,375 | $1,375 | $6,000 |
| 2020 | $249 | $7,375 | $1,375 | $6,000 |
| 2019 | $208 | $7,375 | $1,375 | $6,000 |
| 2018 | $249 | $7,375 | $1,375 | $6,000 |
| 2017 | $249 | $7,375 | $1,375 | $6,000 |
| 2016 | $270 | $7,625 | $1,375 | $6,250 |
| 2015 | $255 | $7,625 | $1,375 | $6,250 |
| 2014 | $240 | $7,189 | $0 | $0 |
Source: Public Records
Map
Nearby Homes
- 630 Marietta St
- 320 Park St
- 122 Fiddlers Ct
- 614 Yokley Ln
- 418 Jones St
- 525 E Washington St
- 808 N 1st St
- 207 N Cedar Ln
- 550 E Jefferson St
- 408 McKibbon Ln
- 544 E Madison St
- 632 E Madison St
- 613 Mcgrew St
- 527 E Madison St
- 1035 N 3rd St
- 308 W Woodring St
- 0 Sumpter St
- 350 N 3rd St
- 523 Highland Ave
- 958 Dollar Hollow Rd
- 548 Cherry St
- 606 Marietta St
- 534 Park St
- 529 Cherry St
- 600 Marietta St
- 540 Park St
- 640 Marietta St
- 625 Marietta St
- 560 Culpepper St
- 530 Marietta St
- 550 Culpepper St
- 541 Park St
- 0 N of Mareitta St Unit RTC2388561
- 537 Park St
- 557 Culpepper St Unit 1
- 527 E Grigsby St
- 525 Culpepper St Extended
- 0 Culpepper St Extended Unit RTC2388557
- 819 E Grigsby St
- 535 Park St
Your Personal Tour Guide
Ask me questions while you tour the home.