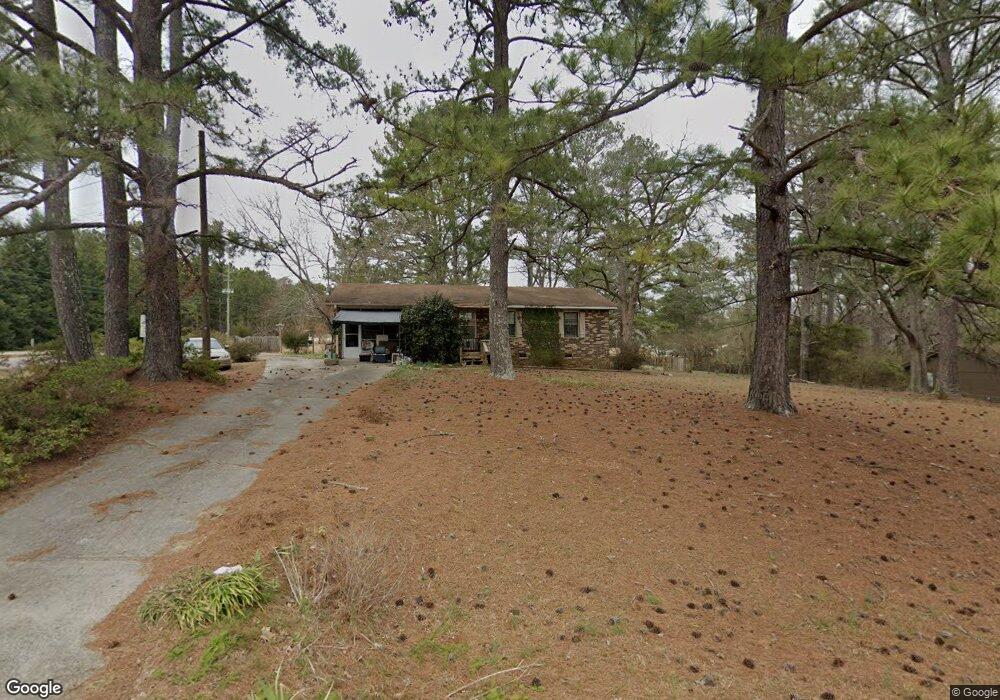
543 Dutchman Rd Griffin, GA 30223
Spalding County NeighborhoodEstimated Value: $126,521 - $200,000
--
Bed
2
Baths
1,026
Sq Ft
$156/Sq Ft
Est. Value
About This Home
This home is located at 543 Dutchman Rd, Griffin, GA 30223 and is currently estimated at $160,130, approximately $156 per square foot. 543 Dutchman Rd is a home located in Spalding County with nearby schools including Jackson Road Elementary School, Kennedy Road Middle School, and Spalding High School.
Ownership History
Date
Name
Owned For
Owner Type
Purchase Details
Closed on
May 13, 1983
Sold by
Evans F J
Bought by
Campbell Betty B
Current Estimated Value
Purchase Details
Closed on
Aug 13, 1982
Sold by
Belmont Prop Inc
Bought by
Evans F J
Purchase Details
Closed on
Apr 15, 1969
Sold by
Irby Bennie
Bought by
Belmont Prop Inc
Purchase Details
Closed on
Feb 8, 1968
Sold by
Forrer Arthur Etal
Bought by
Irby Bennie
Purchase Details
Closed on
Mar 8, 1967
Bought by
Forrer Arthur and Goldstein Louis W
Create a Home Valuation Report for This Property
The Home Valuation Report is an in-depth analysis detailing your home's value as well as a comparison with similar homes in the area
Home Values in the Area
Average Home Value in this Area
Purchase History
| Date | Buyer | Sale Price | Title Company |
|---|---|---|---|
| Campbell Betty B | $35,700 | -- | |
| Evans F J | $4,000 | -- | |
| Belmont Prop Inc | $10,000 | -- | |
| Irby Bennie | $9,000 | -- | |
| Forrer Arthur | -- | -- |
Source: Public Records
Tax History Compared to Growth
Tax History
| Year | Tax Paid | Tax Assessment Tax Assessment Total Assessment is a certain percentage of the fair market value that is determined by local assessors to be the total taxable value of land and additions on the property. | Land | Improvement |
|---|---|---|---|---|
| 2024 | $1,223 | $34,161 | $6,432 | $27,729 |
| 2023 | $1,157 | $31,808 | $6,432 | $25,376 |
| 2022 | $1,001 | $27,532 | $5,628 | $21,904 |
| 2021 | $896 | $24,640 | $5,628 | $19,012 |
| 2020 | $899 | $24,640 | $5,628 | $19,012 |
| 2019 | $917 | $24,640 | $5,628 | $19,012 |
| 2018 | $875 | $22,890 | $5,628 | $17,262 |
| 2017 | $851 | $22,890 | $5,628 | $17,262 |
| 2016 | $866 | $22,890 | $5,628 | $17,262 |
| 2015 | $892 | $22,890 | $5,628 | $17,262 |
| 2014 | $910 | $22,890 | $5,628 | $17,262 |
Source: Public Records
Map
Nearby Homes
- 273 Dutchman Rd
- 140 Morris Mill Rd
- 1147 N Mcdonough Rd
- 1015 Dutchman Rd
- 2650 Jackson Rd
- 1015 N Walkers Mill Rd
- 2775 Jackson Rd
- 414 Allison Dr
- 265 Hamil Rd Unit LOT 9
- 243 Hamil Rd Unit 13.18 AC
- 221 Hamil Rd Unit 12.5 AC
- 243 Hamil Rd
- 501 Musgrove Rd
- 860 N Walkers Mill Rd
- 2524 E Mcintosh Rd
- 0 Chehaw Rd Unit 10594275
- 0 Chehaw Rd Unit 10594272
- 0 Hamil Rd Unit 6.21 AC 10578337
- 230 Sapelo Rd
- 0 N Mcdonough Rd Unit 10599249
- 561 Dutchman Rd
- 852 N Mcdonough Rd
- 581 Dutchman Rd
- 850 N Mcdonough Rd
- 490 Dutchman Rd
- 946 N Mcdonough Rd
- 103 Dutch Dr
- 848 N Mcdonough Rd
- .9 ACRES Dutchman Rd
- 588 Dutchman Rd
- 486 Dutchman Rd
- 846 N Mcdonough Rd
- 633 Dutchman Rd
- 853 N Mcdonough Rd
- 449 Dutchman Rd
- 448 Dutchman Rd
- 600 Dutchman Rd
- 999 N Mcdonough Rd
- 445 Dutchman Rd
- 109 Dutch Dr Unit 3