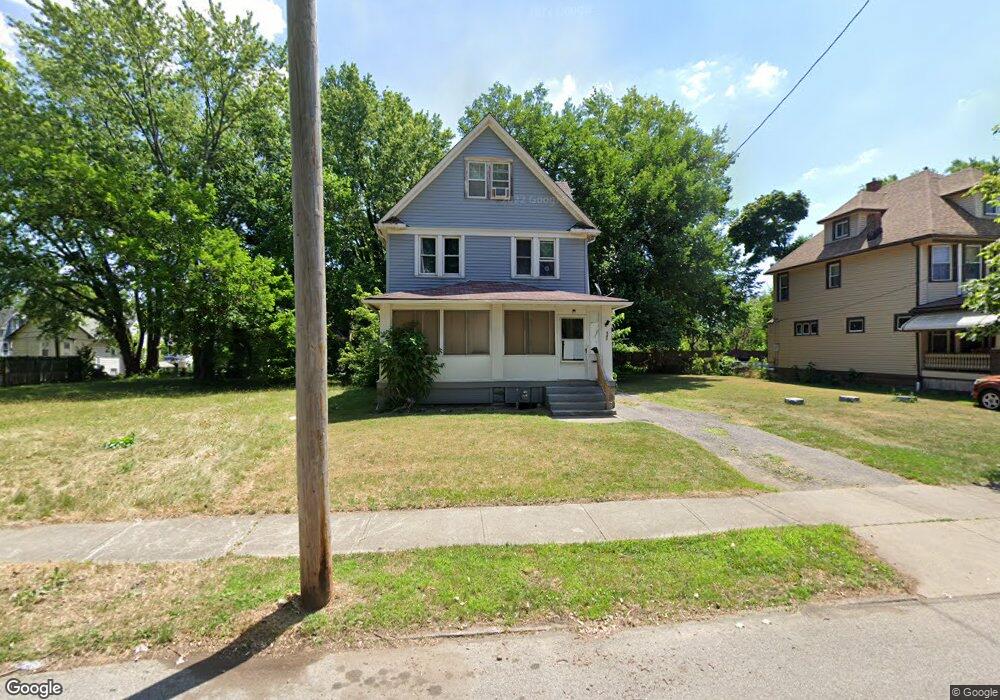
543 E 109th St Cleveland, OH 44108
Glenville NeighborhoodEstimated Value: $70,529 - $101,000
3
Beds
1
Bath
1,266
Sq Ft
$70/Sq Ft
Est. Value
About This Home
This home is located at 543 E 109th St, Cleveland, OH 44108 and is currently estimated at $88,632, approximately $70 per square foot. 543 E 109th St is a home located in Cuyahoga County with nearby schools including Stonebrook Montessori, Citizens Academy, and St. Aloysius - St. Agatha School.
Ownership History
Date
Name
Owned For
Owner Type
Purchase Details
Closed on
Jan 13, 2020
Sold by
A & A Equity Pros Llc
Bought by
Rbj Group Llc
Current Estimated Value
Purchase Details
Closed on
May 25, 2019
Sold by
Johnson Shawn Adrian
Bought by
A & A Equity Pros Llc
Purchase Details
Closed on
May 29, 2018
Sold by
Winsorproperties Llc
Bought by
Johnson Shawn A
Purchase Details
Closed on
Oct 3, 2017
Sold by
Wood Cove Iii Llc
Bought by
Rfi Holdings Llc
Purchase Details
Closed on
Sep 29, 2017
Sold by
Rei Holdings Llc
Bought by
Winsorproperties Llc
Purchase Details
Closed on
Jul 28, 2017
Sold by
Devisees Legatees And Assigns Of Willa M
Bought by
Woods Cove Iii Llc
Purchase Details
Closed on
Jul 5, 1989
Sold by
Officer Luther Douglas
Bought by
Officer Willia Mae
Purchase Details
Closed on
Aug 22, 1980
Sold by
Boykins Johnie and Mark Ree
Bought by
Officer Luther Douglas
Purchase Details
Closed on
Feb 4, 1980
Sold by
Boykin Johnnie and Boykin Mark R
Bought by
Boykins Johnie and Mark Ree
Purchase Details
Closed on
Jan 1, 1975
Bought by
Boykin Johnnie and Boykin Mark R
Create a Home Valuation Report for This Property
The Home Valuation Report is an in-depth analysis detailing your home's value as well as a comparison with similar homes in the area
Home Values in the Area
Average Home Value in this Area
Purchase History
| Date | Buyer | Sale Price | Title Company |
|---|---|---|---|
| Rbj Group Llc | -- | None Available | |
| A & A Equity Pros Llc | $20,200 | None Available | |
| Johnson Shawn A | $31,000 | None Available | |
| Rfi Holdings Llc | $7,323 | Accommodation | |
| Winsorproperties Llc | $12,287 | Accommodation | |
| Woods Cove Iii Llc | $14,222 | None Available | |
| Officer Willia Mae | -- | -- | |
| Officer Luther Douglas | $19,000 | -- | |
| Boykins Johnie | -- | -- | |
| Boykin Johnnie | -- | -- |
Source: Public Records
Tax History
| Year | Tax Paid | Tax Assessment Tax Assessment Total Assessment is a certain percentage of the fair market value that is determined by local assessors to be the total taxable value of land and additions on the property. | Land | Improvement |
|---|---|---|---|---|
| 2024 | $1,093 | $16,345 | $2,975 | $13,370 |
| 2023 | $668 | $8,620 | $2,350 | $6,270 |
| 2022 | $664 | $8,610 | $2,345 | $6,265 |
| 2021 | $658 | $8,610 | $2,350 | $6,270 |
| 2020 | $625 | $7,070 | $1,930 | $5,150 |
| 2019 | $579 | $20,200 | $5,500 | $14,700 |
| 2018 | $1,021 | $7,070 | $1,930 | $5,150 |
| 2017 | $1,784 | $10,860 | $2,140 | $8,720 |
| 2016 | $889 | $10,860 | $2,140 | $8,720 |
| 2015 | $4,080 | $10,860 | $2,140 | $8,720 |
| 2014 | $4,080 | $12,040 | $2,380 | $9,660 |
Source: Public Records
Map
Nearby Homes
- 528 E 109th St
- 10811 Sprague Ave
- 10724 Sprague Ave
- 550 E 107th St
- 472 E 110th St
- 521 E 112th St
- 10626 Dupont Ave
- 10639 Dupont Ave
- 571 E 115th St
- 10525 Elk Ave
- 680 E 115th St
- 742 Linn Dr
- 475 E 118th St
- 519 E 103rd St
- 11606 Shadeland Ave
- 10703 Kimberley Ave
- 554 Eddy Rd
- 512 Eddy Rd
- 10605 Kimberley Ave
- 786 Parkwood Dr
Your Personal Tour Guide
Ask me questions while you tour the home.