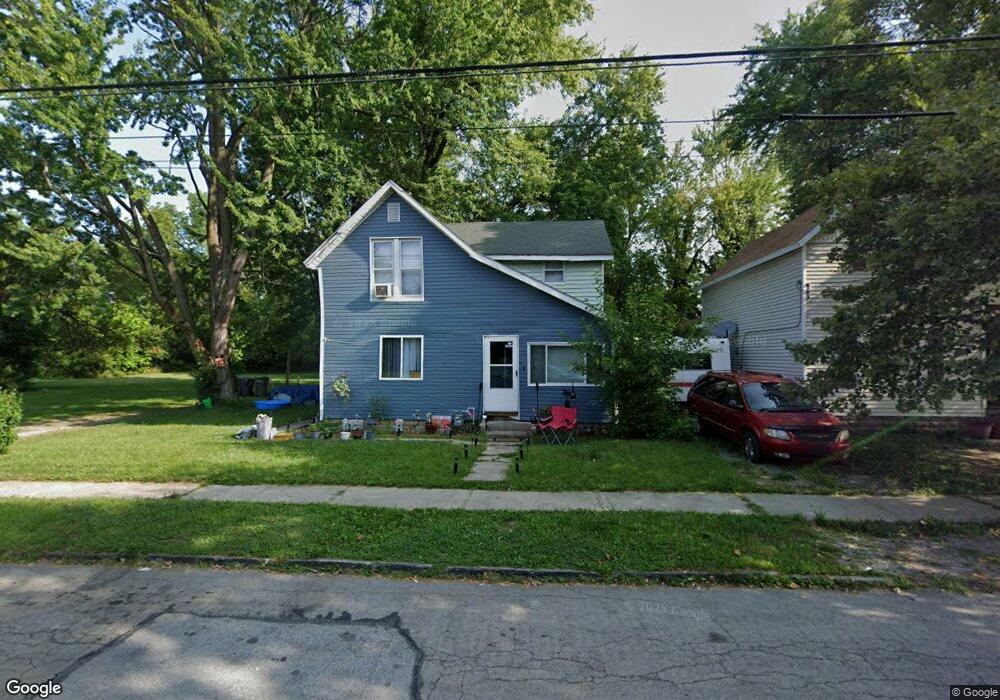
543 E 2nd St Lima, OH 45804
Southside Lima NeighborhoodEstimated Value: $46,000 - $83,000
4
Beds
1
Bath
1,260
Sq Ft
$48/Sq Ft
Est. Value
About This Home
This home is located at 543 E 2nd St, Lima, OH 45804 and is currently estimated at $60,497, approximately $48 per square foot. 543 E 2nd St is a home located in Allen County with nearby schools including Unity Elementary School, Lima North Middle School, and Lima West Middle School.
Ownership History
Date
Name
Owned For
Owner Type
Purchase Details
Closed on
Apr 16, 2024
Sold by
Lewis Trevante
Bought by
Tsmiths Llc Investment
Current Estimated Value
Purchase Details
Closed on
Apr 28, 2021
Sold by
Coleman Felisha
Bought by
Lewis Trevante
Purchase Details
Closed on
Dec 16, 2019
Sold by
Turner Alim Amir
Bought by
Coleman Felisha
Purchase Details
Closed on
Aug 23, 2017
Sold by
Thomas Rickie L
Bought by
Turner Alim Amir
Purchase Details
Closed on
Mar 10, 2016
Sold by
Eberle Timothy J and Eberle Kristi J
Bought by
Thomas Rickie L
Purchase Details
Closed on
Apr 2, 2015
Sold by
Reed Frederick F and Risser Susan K
Bought by
Eberle Timothy J and Eberle Kristi J
Purchase Details
Closed on
Aug 18, 2000
Sold by
Lawrence Ilean
Bought by
Risser Fred F Reed Susan
Purchase Details
Closed on
Jul 1, 1971
Bought by
Lawrence Ilean
Create a Home Valuation Report for This Property
The Home Valuation Report is an in-depth analysis detailing your home's value as well as a comparison with similar homes in the area
Home Values in the Area
Average Home Value in this Area
Purchase History
| Date | Buyer | Sale Price | Title Company |
|---|---|---|---|
| Tsmiths Llc Investment | $4,300 | None Listed On Document | |
| Lewis Trevante | $2,500 | None Available | |
| Coleman Felisha | $6,000 | None Available | |
| Turner Alim Amir | $1,000 | None Available | |
| Thomas Rickie L | $1,300 | None Available | |
| Eberle Timothy J | $19,900 | None Available | |
| Risser Fred F Reed Susan | $8,500 | -- | |
| Lawrence Ilean | $5,000 | -- |
Source: Public Records
Tax History
| Year | Tax Paid | Tax Assessment Tax Assessment Total Assessment is a certain percentage of the fair market value that is determined by local assessors to be the total taxable value of land and additions on the property. | Land | Improvement |
|---|---|---|---|---|
| 2024 | $596 | $10,710 | $1,330 | $9,380 |
| 2023 | $628 | $10,190 | $1,260 | $8,930 |
| 2022 | $961 | $10,190 | $1,260 | $8,930 |
| 2021 | $1,069 | $10,190 | $1,260 | $8,930 |
| 2020 | $555 | $10,120 | $1,230 | $8,890 |
| 2019 | $555 | $10,120 | $1,230 | $8,890 |
| 2018 | $1,277 | $10,120 | $1,230 | $8,890 |
| 2017 | $1,256 | $10,120 | $1,230 | $8,890 |
| 2016 | $1,723 | $10,120 | $1,230 | $8,890 |
| 2015 | $413 | $6,550 | $1,230 | $5,320 |
| 2014 | $413 | $6,970 | $1,300 | $5,670 |
| 2013 | $1,387 | $6,970 | $1,300 | $5,670 |
Source: Public Records
Map
Nearby Homes
- 547 E 2nd St
- 962 Saint Johns Ave
- 960 Saint Johns Ave
- 542 E 2nd St
- 544 E 2nd St
- 546 E 2nd St
- 538 E 2nd St
- 950 Saint Johns Ave
- 959 Saint Johns Ave
- 510 E 2nd St
- 965 Saint Johns Ave
- 955 Saint Johns Ave
- 953 Saint Johns Ave
- 1053 Hughes Ave
- 951 Saint Johns Ave
- 949 Saint Johns Ave
- 508 Fairview Ave
- 3615 Saint Johns Ave
- N/A Saint Johns Ave
- 506 E 2nd St
Your Personal Tour Guide
Ask me questions while you tour the home.