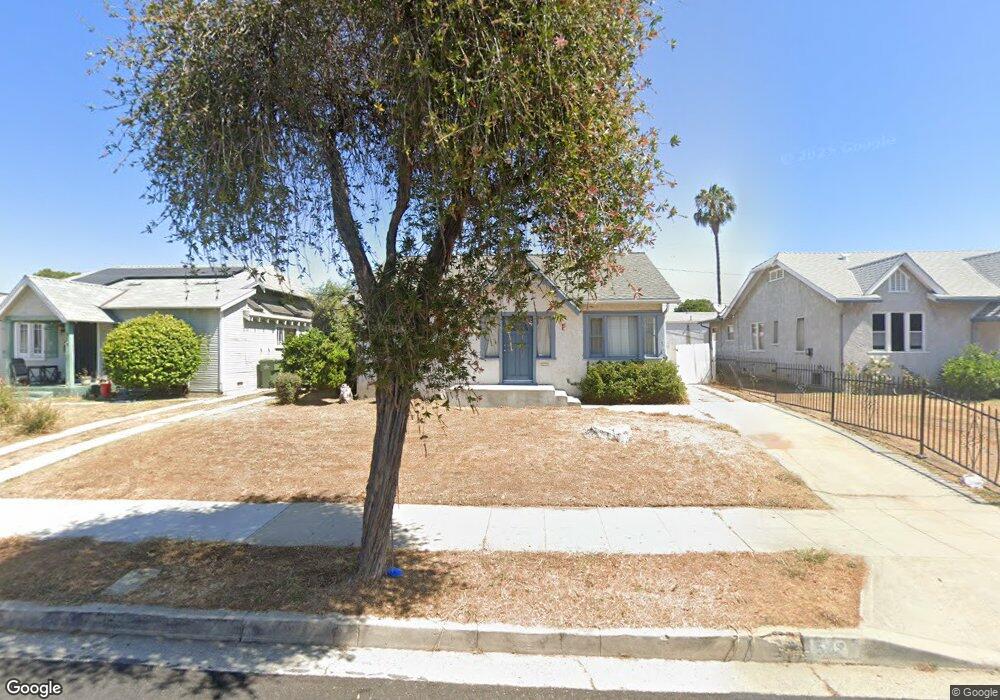
543 E Brett St Inglewood, CA 90302
North Inglewood NeighborhoodEstimated Value: $554,000 - $841,341
3
Beds
1
Bath
1,094
Sq Ft
$699/Sq Ft
Est. Value
About This Home
This home is located at 543 E Brett St, Inglewood, CA 90302 and is currently estimated at $765,085, approximately $699 per square foot. 543 E Brett St is a home located in Los Angeles County with nearby schools including Centinela Elementary School, Crozier (George W.) Middle School, and Inglewood High School.
Ownership History
Date
Name
Owned For
Owner Type
Purchase Details
Closed on
Feb 2, 2004
Sold by
Chao Charles Y
Bought by
Lim Kahntze
Current Estimated Value
Home Financials for this Owner
Home Financials are based on the most recent Mortgage that was taken out on this home.
Original Mortgage
$135,000
Interest Rate
5.69%
Mortgage Type
Seller Take Back
Create a Home Valuation Report for This Property
The Home Valuation Report is an in-depth analysis detailing your home's value as well as a comparison with similar homes in the area
Home Values in the Area
Average Home Value in this Area
Purchase History
| Date | Buyer | Sale Price | Title Company |
|---|---|---|---|
| Lim Kahntze | $235,000 | Southland Title | |
| Chao Charles Y | -- | Southland Title |
Source: Public Records
Mortgage History
| Date | Status | Borrower | Loan Amount |
|---|---|---|---|
| Previous Owner | Lim Kahntze | $135,000 |
Source: Public Records
Tax History
| Year | Tax Paid | Tax Assessment Tax Assessment Total Assessment is a certain percentage of the fair market value that is determined by local assessors to be the total taxable value of land and additions on the property. | Land | Improvement |
|---|---|---|---|---|
| 2025 | $6,166 | $469,170 | $398,092 | $71,078 |
| 2024 | $6,166 | $459,972 | $390,287 | $69,685 |
| 2023 | $6,103 | $450,954 | $382,635 | $68,319 |
| 2022 | $6,219 | $442,113 | $375,133 | $66,980 |
| 2021 | $6,162 | $433,445 | $367,778 | $65,667 |
| 2019 | $5,791 | $420,590 | $356,870 | $63,720 |
| 2018 | $5,779 | $412,344 | $349,873 | $62,471 |
| 2016 | $5,480 | $396,335 | $336,288 | $60,047 |
| 2015 | $5,432 | $390,383 | $331,237 | $59,146 |
| 2014 | $5,427 | $382,737 | $324,749 | $57,988 |
Source: Public Records
Map
Nearby Homes
- 376 E Hillsdale St
- 540 E Hyde Park Place
- 370 E Hillsdale St
- 579 E Hyde Park Place
- 534 Hyde Park Place
- 610 E Fairview Blvd
- 612 E Fairview Blvd
- 4470 W 64th St
- 1118 Marlborough Ave
- 1206 N La Brea Ave
- 4124 W 64th St
- 523 E Hazel St
- 519 N Exton Ave
- 711 Stepney St
- 1109 N Chester Ave
- 563 E Hazel St Unit 6
- 802 N Market St
- 6312 S Verdun Ave
- 121 W Fairview Blvd
- 127 W Plymouth St
- 539 E Brett St
- 547 E Brett St
- 535 E Brett St
- 551 E Brett St
- 531 E Brett St
- 555 E Brett St
- 542 Hargrave St
- 538 Hargrave St
- 546 Hargrave St
- 550 Hargrave St
- 534 Hargrave St
- 527 E Brett St
- 559 E Brett St
- 542 E Brett St
- 538 E Brett St
- 546 E Brett St
- 554 Hargrave St
- 530 Hargrave St
- 534 E Brett St
- 550 E Brett St
Your Personal Tour Guide
Ask me questions while you tour the home.