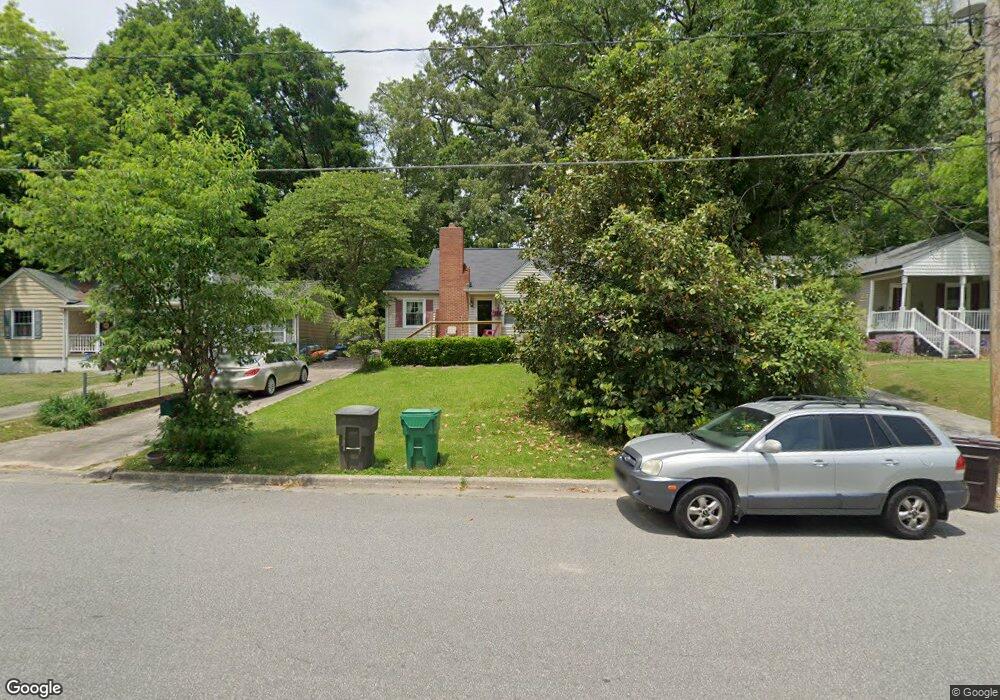
543 E Farriss Ave High Point, NC 27262
Greater High Point NeighborhoodEstimated Value: $187,661 - $273,000
2
Beds
1
Bath
1,314
Sq Ft
$168/Sq Ft
Est. Value
About This Home
This home is located at 543 E Farriss Ave, High Point, NC 27262 and is currently estimated at $220,415, approximately $167 per square foot. 543 E Farriss Ave is a home located in Guilford County with nearby schools including Kirkman Park Elementary School, Penn-Griffin School for the Arts, and T.W. Andrews High School.
Ownership History
Date
Name
Owned For
Owner Type
Purchase Details
Closed on
Mar 26, 2002
Sold by
Bank One National Assn
Bought by
Bohn William W
Current Estimated Value
Home Financials for this Owner
Home Financials are based on the most recent Mortgage that was taken out on this home.
Original Mortgage
$68,400
Outstanding Balance
$28,436
Interest Rate
6.85%
Estimated Equity
$191,979
Purchase Details
Closed on
Nov 9, 2001
Sold by
Tippit Leland Christopher and Tippit Angela
Bought by
Bank One National Assn
Purchase Details
Closed on
Nov 2, 1999
Sold by
Lyda Janice L and Lyda Edward A
Bought by
Tippit Leland Christopher and Tippit Angela
Home Financials for this Owner
Home Financials are based on the most recent Mortgage that was taken out on this home.
Original Mortgage
$64,000
Interest Rate
7.81%
Create a Home Valuation Report for This Property
The Home Valuation Report is an in-depth analysis detailing your home's value as well as a comparison with similar homes in the area
Home Values in the Area
Average Home Value in this Area
Purchase History
| Date | Buyer | Sale Price | Title Company |
|---|---|---|---|
| Bohn William W | $85,500 | -- | |
| Bank One National Assn | $71,770 | -- | |
| Tippit Leland Christopher | $80,000 | -- |
Source: Public Records
Mortgage History
| Date | Status | Borrower | Loan Amount |
|---|---|---|---|
| Open | Bohn William W | $68,400 | |
| Previous Owner | Tippit Leland Christopher | $64,000 | |
| Closed | Tippit Leland Christopher | $8,000 |
Source: Public Records
Tax History Compared to Growth
Tax History
| Year | Tax Paid | Tax Assessment Tax Assessment Total Assessment is a certain percentage of the fair market value that is determined by local assessors to be the total taxable value of land and additions on the property. | Land | Improvement |
|---|---|---|---|---|
| 2025 | $1,466 | $106,400 | $30,000 | $76,400 |
| 2024 | $1,466 | $106,400 | $30,000 | $76,400 |
| 2023 | $1,466 | $106,400 | $30,000 | $76,400 |
| 2022 | $1,434 | $106,400 | $30,000 | $76,400 |
| 2021 | $1,119 | $81,200 | $22,000 | $59,200 |
| 2020 | $1,119 | $81,200 | $22,000 | $59,200 |
| 2019 | $1,119 | $81,200 | $0 | $0 |
| 2018 | $1,113 | $81,200 | $0 | $0 |
| 2017 | $1,113 | $81,200 | $0 | $0 |
| 2016 | $1,139 | $81,200 | $0 | $0 |
| 2015 | $1,145 | $81,200 | $0 | $0 |
| 2014 | $1,164 | $81,200 | $0 | $0 |
Source: Public Records
Map
Nearby Homes
- 719 Forrest St
- 313 Woodrow Ave
- 509 Woodrow Ave
- 326 Louise Ave
- 910 E Dayton Ave
- 907 E Dayton Ave
- 504 Avalon Place
- 1108 Forrest St
- 1110 Forrest St
- 506 Denny St
- 1013 Johnson St
- 410 4th St
- 505 Forrest St
- 1428 Futrelle Dr
- 905 Mint Ave
- 828 Willow Place
- 837 Willow Place
- 1207 N Main St
- 1507 Larkin St
- 207 Hillcrest Dr
- 545 E Farriss Ave
- 541 E Farriss Ave
- 811 Putnam St
- 819 Putnam St
- 539 E Farriss Ave
- 547 E Farriss Ave
- 821 Putnam St
- 537 E Farriss Ave
- 542 E Farriss Ave
- 823 Putnam St
- 540 E Farriss Ave
- 544 E Farriss Ave
- 535 E Farriss Ave
- 814 Putnam St
- 810 Putnam St
- 816 Putnam St
- 538 E Farriss Ave
- 546 E Farriss Ave
- 820 Putnam St
- 808 Putnam St