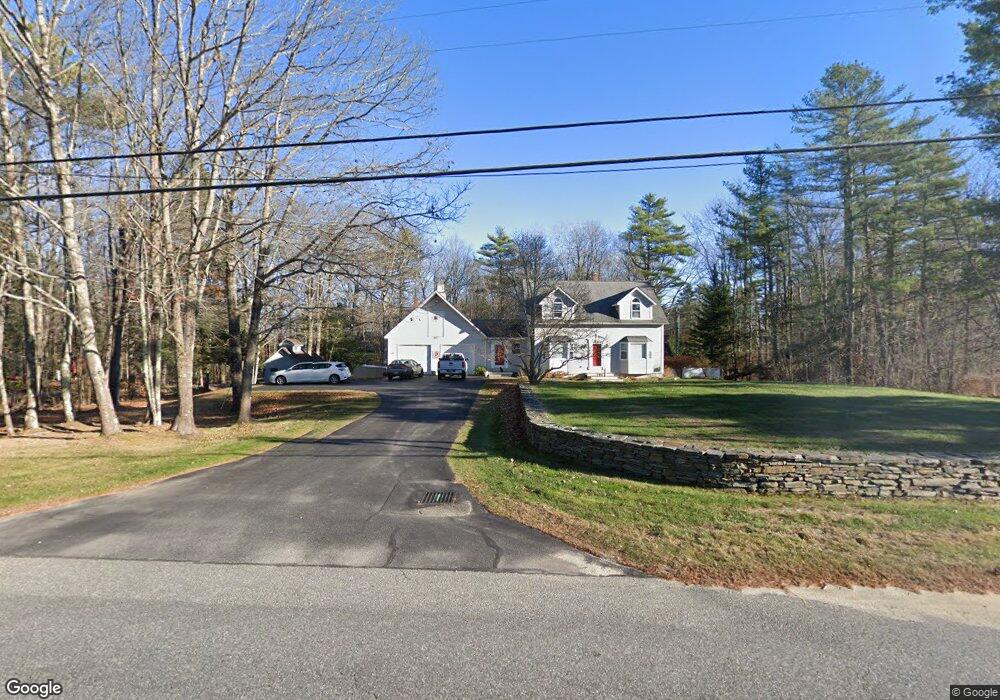
543 Foreside Rd Topsham, ME 04086
Estimated Value: $495,000 - $569,000
3
Beds
2
Baths
2,336
Sq Ft
$226/Sq Ft
Est. Value
About This Home
This home is located at 543 Foreside Rd, Topsham, ME 04086 and is currently estimated at $528,140, approximately $226 per square foot. 543 Foreside Rd is a home located in Sagadahoc County with nearby schools including Mt Ararat High School and St John's Catholic School.
Ownership History
Date
Name
Owned For
Owner Type
Purchase Details
Closed on
Apr 10, 2015
Sold by
Manchester Janie L and Greene James N
Bought by
Jones Mark E
Current Estimated Value
Home Financials for this Owner
Home Financials are based on the most recent Mortgage that was taken out on this home.
Original Mortgage
$249,750
Outstanding Balance
$191,917
Interest Rate
3.77%
Mortgage Type
New Conventional
Estimated Equity
$336,223
Purchase Details
Closed on
Jul 3, 2012
Sold by
Rossignol Paul L
Bought by
Manchester Janie L and Greene James N
Home Financials for this Owner
Home Financials are based on the most recent Mortgage that was taken out on this home.
Original Mortgage
$269,000
Interest Rate
3.78%
Mortgage Type
New Conventional
Create a Home Valuation Report for This Property
The Home Valuation Report is an in-depth analysis detailing your home's value as well as a comparison with similar homes in the area
Home Values in the Area
Average Home Value in this Area
Purchase History
| Date | Buyer | Sale Price | Title Company |
|---|---|---|---|
| Jones Mark E | -- | -- | |
| Manchester Janie L | -- | -- |
Source: Public Records
Mortgage History
| Date | Status | Borrower | Loan Amount |
|---|---|---|---|
| Open | Jones Mark E | $249,750 | |
| Previous Owner | Manchester Janie L | $269,000 |
Source: Public Records
Tax History
| Year | Tax Paid | Tax Assessment Tax Assessment Total Assessment is a certain percentage of the fair market value that is determined by local assessors to be the total taxable value of land and additions on the property. | Land | Improvement |
|---|---|---|---|---|
| 2025 | $7,132 | $557,200 | $70,100 | $487,100 |
| 2024 | $7,016 | $561,300 | $65,300 | $496,000 |
| 2023 | $6,850 | $504,400 | $62,200 | $442,200 |
| 2022 | $5,938 | $411,800 | $60,000 | $351,800 |
| 2021 | $5,777 | $364,000 | $55,200 | $308,800 |
| 2020 | $5,815 | $325,600 | $55,200 | $270,400 |
| 2019 | $5,586 | $291,700 | $55,200 | $236,500 |
| 2018 | $5,196 | $277,400 | $49,600 | $227,800 |
| 2017 | $5,026 | $277,400 | $49,600 | $227,800 |
| 2016 | $4,908 | $272,800 | $49,600 | $223,200 |
| 2015 | $4,736 | $263,700 | $49,600 | $214,100 |
| 2014 | $4,410 | $254,500 | $49,600 | $204,900 |
| 2013 | $3,848 | $231,100 | $49,600 | $181,500 |
Source: Public Records
Map
Nearby Homes
Your Personal Tour Guide
Ask me questions while you tour the home.