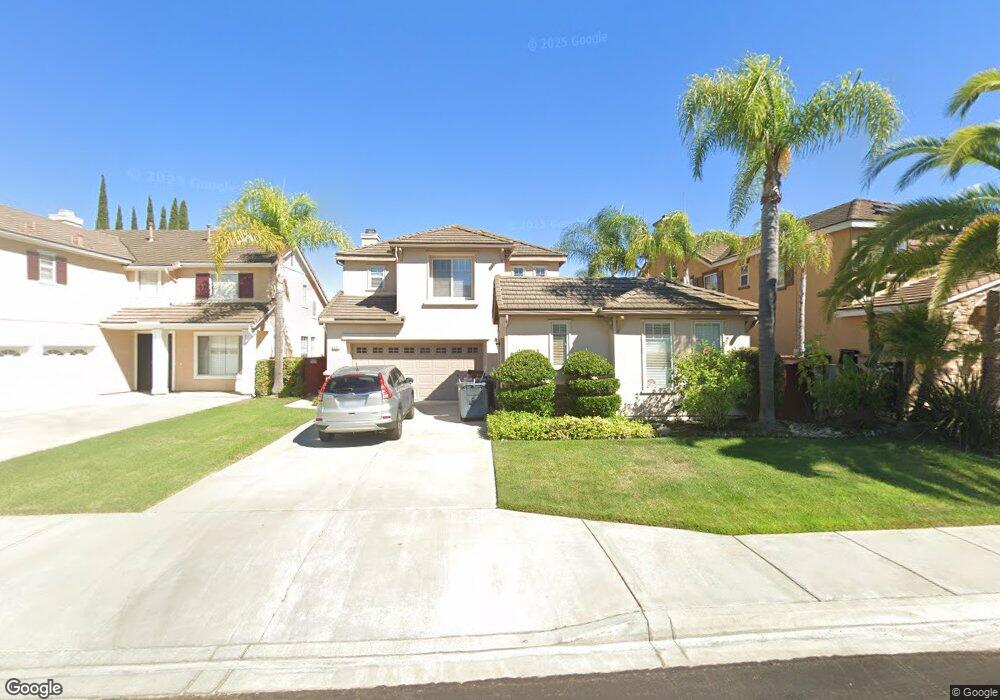
543 Golf Glen Dr Unit 5 San Marcos, CA 92069
Estimated Value: $1,126,934 - $1,205,000
4
Beds
3
Baths
2,296
Sq Ft
$511/Sq Ft
Est. Value
About This Home
This home is located at 543 Golf Glen Dr Unit 5, San Marcos, CA 92069 and is currently estimated at $1,173,734, approximately $511 per square foot. 543 Golf Glen Dr Unit 5 is a home located in San Diego County with nearby schools including Twin Oaks Elementary School, Woodland Park Middle School, and Mission Hills High School.
Ownership History
Date
Name
Owned For
Owner Type
Purchase Details
Closed on
Jul 30, 2014
Sold by
Blakeney Katherine T
Bought by
Blakeney Katherine Theone
Current Estimated Value
Purchase Details
Closed on
Jan 13, 2014
Sold by
Blakeney Robert D
Bought by
Blakeney Katherine T
Purchase Details
Closed on
Jul 31, 2002
Sold by
Blakeney Robert D
Bought by
Blakeney Ii Robert D
Purchase Details
Closed on
Nov 6, 2001
Sold by
Long Christopher R and Long Renee L
Bought by
Blakeney Ii Robert D
Purchase Details
Closed on
Oct 13, 1999
Sold by
Ryland Homes Of California Inc
Bought by
Long Christopher R and Long Renee L
Home Financials for this Owner
Home Financials are based on the most recent Mortgage that was taken out on this home.
Original Mortgage
$236,100
Interest Rate
7.99%
Create a Home Valuation Report for This Property
The Home Valuation Report is an in-depth analysis detailing your home's value as well as a comparison with similar homes in the area
Home Values in the Area
Average Home Value in this Area
Purchase History
| Date | Buyer | Sale Price | Title Company |
|---|---|---|---|
| Blakeney Katherine Theone | -- | None Available | |
| Blakeney Katherine T | -- | None Available | |
| Blakeney Ii Robert D | -- | -- | |
| Blakeney Ii Robert D | $345,000 | Equity Title Company | |
| Long Christopher R | $295,500 | Lawyers Title |
Source: Public Records
Mortgage History
| Date | Status | Borrower | Loan Amount |
|---|---|---|---|
| Previous Owner | Long Christopher R | $236,100 | |
| Closed | Long Christopher R | $59,000 |
Source: Public Records
Tax History Compared to Growth
Tax History
| Year | Tax Paid | Tax Assessment Tax Assessment Total Assessment is a certain percentage of the fair market value that is determined by local assessors to be the total taxable value of land and additions on the property. | Land | Improvement |
|---|---|---|---|---|
| 2025 | $8,264 | $631,306 | $245,166 | $386,140 |
| 2024 | $8,264 | $618,928 | $240,359 | $378,569 |
| 2023 | $8,079 | $606,794 | $235,647 | $371,147 |
| 2022 | $7,910 | $594,897 | $231,027 | $363,870 |
| 2021 | $7,735 | $583,234 | $226,498 | $356,736 |
| 2020 | $7,650 | $577,255 | $224,176 | $353,079 |
| 2019 | $7,544 | $565,937 | $219,781 | $346,156 |
| 2018 | $7,303 | $554,841 | $215,472 | $339,369 |
| 2017 | $7,129 | $543,963 | $211,248 | $332,715 |
| 2016 | $6,994 | $533,298 | $207,106 | $326,192 |
| 2015 | $6,941 | $525,289 | $203,996 | $321,293 |
| 2014 | $5,652 | $415,754 | $162,685 | $253,069 |
Source: Public Records
Map
Nearby Homes
- 157 Montessa Way
- 362 Borden Rd
- 106 Chesapeake Ct
- 320 Crownview Ct
- 1366 Topanga Dr
- 101 Christen Way
- 908 Lantana Ct
- 516 Moonlight Dr
- 315 Sunbird Ct
- 452 Fitzpatrick Rd
- 789 Pebble Beach Dr
- 209 Mission Villas Rd
- 303 Mission Villas Rd
- 1221 Gable Ct
- 1204 Gable Ct
- 679 Glasgow Ct
- 0 Via Las Brisas
- 241 Muirfield Way
- 139 Avenida Chapala Unit 106
- 500 Rancheros Dr Unit 191
- 541 Golf Glen Dr
- 545 Golf Glen Dr
- 549 Golf Glen Dr
- 539 Golf Glen Dr Unit 5
- 551 Golf Glen Dr
- 537 Golf Glen Dr
- 506 Peach Way
- 508 Peach Way
- 544 Golf Glen Dr
- 542 Golf Glen Dr
- 546 Golf Glen Dr
- 553 Golf Glen Dr
- 535 Golf Glen Dr
- 540 Golf Glen Dr
- 510 Peach Way
- 502 Peach Way
- 548 Golf Glen Dr
- 504 Peach Way
- 538 Golf Glen Dr
- 550 Golf Glen Dr