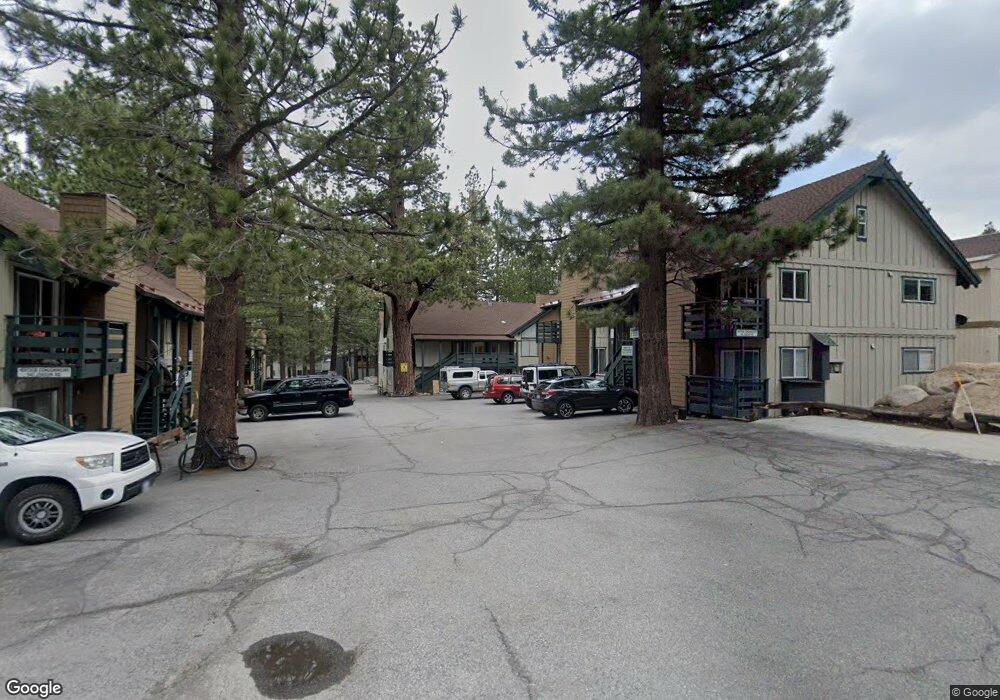
543 Joaquin Rd Unit 101 Mammoth Lakes, CA 93546
Estimated Value: $516,000 - $614,000
2
Beds
2
Baths
831
Sq Ft
$661/Sq Ft
Est. Value
About This Home
This home is located at 543 Joaquin Rd Unit 101, Mammoth Lakes, CA 93546 and is currently estimated at $549,170, approximately $660 per square foot. 543 Joaquin Rd Unit 101 is a home located in Mono County with nearby schools including Mammoth Elementary School, Mammoth Middle School, and Mammoth High School.
Ownership History
Date
Name
Owned For
Owner Type
Purchase Details
Closed on
Apr 23, 2019
Sold by
Chen Oscar
Bought by
Yang Qianyun
Current Estimated Value
Home Financials for this Owner
Home Financials are based on the most recent Mortgage that was taken out on this home.
Original Mortgage
$204,750
Outstanding Balance
$178,902
Interest Rate
4%
Mortgage Type
New Conventional
Estimated Equity
$370,268
Purchase Details
Closed on
Apr 18, 2019
Sold by
Malec Jason Robert and Smith Douglas A
Bought by
Yang Qianyun
Home Financials for this Owner
Home Financials are based on the most recent Mortgage that was taken out on this home.
Original Mortgage
$204,750
Outstanding Balance
$178,902
Interest Rate
4%
Mortgage Type
New Conventional
Estimated Equity
$370,268
Purchase Details
Closed on
Nov 24, 2015
Sold by
Eggers Robert S and Eggers Vicki E
Bought by
Malec Jason Robert and Smith Douglas A
Purchase Details
Closed on
Jun 4, 2006
Sold by
Arreola Robert A and Arreola Anne E
Bought by
Eggers Robert S and Eggers Vicki E
Create a Home Valuation Report for This Property
The Home Valuation Report is an in-depth analysis detailing your home's value as well as a comparison with similar homes in the area
Home Values in the Area
Average Home Value in this Area
Purchase History
| Date | Buyer | Sale Price | Title Company |
|---|---|---|---|
| Yang Qianyun | -- | Inyo-Mono Title | |
| Yang Qianyun | $315,000 | Inyo-Mono Title | |
| Malec Jason Robert | $160,000 | Inyo Mono Title Company | |
| Eggers Robert S | -- | None Available |
Source: Public Records
Mortgage History
| Date | Status | Borrower | Loan Amount |
|---|---|---|---|
| Open | Yang Qianyun | $204,750 |
Source: Public Records
Tax History Compared to Growth
Tax History
| Year | Tax Paid | Tax Assessment Tax Assessment Total Assessment is a certain percentage of the fair market value that is determined by local assessors to be the total taxable value of land and additions on the property. | Land | Improvement |
|---|---|---|---|---|
| 2024 | $3,924 | $344,493 | $68,897 | $275,596 |
| 2023 | $3,924 | $337,740 | $67,547 | $270,193 |
| 2022 | $3,878 | $331,119 | $66,223 | $264,896 |
| 2021 | $3,771 | $324,627 | $64,925 | $259,702 |
| 2020 | $3,743 | $321,300 | $64,260 | $257,040 |
| 2019 | $1,976 | $166,394 | $33,278 | $133,116 |
| 2018 | $2,031 | $166,463 | $33,292 | $133,171 |
| 2017 | $1,881 | $163,200 | $32,640 | $130,560 |
| 2016 | $1,851 | $160,000 | $32,000 | $128,000 |
| 2015 | $1,758 | $150,000 | $30,000 | $120,000 |
| 2014 | $1,764 | $150,000 | $30,000 | $120,000 |
Source: Public Records
Map
Nearby Homes
- 526 Lupin St Unit 205
- 463 Mono St Unit 4
- 541 Mono St Unit 4
- 2252 Meridian Blvd Unit 13
- 2252 Meridian Blvd Unit 39
- 19 Evening Star Dr Unit 2
- 1 Evening Star Dr
- 2289 Sierra Nevada Rd Unit F3
- 2289 Sierra Nevada Rd Unit F-15
- 2289 Sierra Nevada Rd Unit F11
- 2004 Sierra Star Parkway #18 Unit Solstice 18
- 78 Ridge Way Unit 52
- 67 Obsidian Place Unit 27
- 2113 Meridian Blvd Unit 185
- 30 Sunshine Unit Snowcreek I 30
- 105 Sanctuary Unit 105
- 286 Old Mammoth Rd Unit 80
- 3251 Chateau Rd Unit 12
- 3251 Chateau Rd Unit 38
- 1295 W Bear Lake Dr Unit 22
- 543 Joaquin Rd
- 543 Joaquin Rd Unit 202
- 543 Joaquin Rd Unit 104
- 543 Joaquin Rd Unit Heritage 102
- 543 Joaquin Rd Unit 203
- 543 Joaquin Rd Unit Heritage 204
- 543 Joaquin Rd Unit Heritage 201
- 543 Joaquin Road #1 (Door #101) Unit 1
- 543 Joaquin Road Unit 1 (Door #101) Unit 101
- 543 Joaquin Rd Unit B-104
- 543 Joaquin Rd
- 543 Joaquin #102 Rd Unit 102
- 531 Joaquin Rd Unit 9
- 531 Joaquin Rd Unit Sierra Valley Sites
- 531 Joaquin Rd
- 2534 Meridian Blvd
- 526 Lupin St Unit 105
- 526 Lupin St Unit 207
- 526 Lupin St Unit Heritage 208
- 2610 Meridian Blvd Unit 2:01