543 N Main St Tuscarawas, OH 44682
Estimated Value: $168,000 - $205,000
3
Beds
2
Baths
1,768
Sq Ft
$106/Sq Ft
Est. Value
About This Home
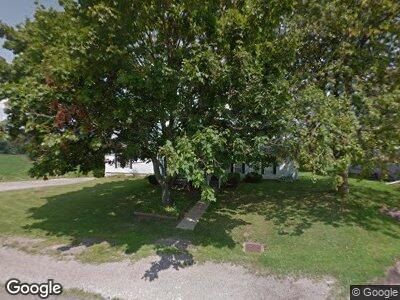
This home is located at 543 N Main St, Tuscarawas, OH 44682 and is currently estimated at $187,671, approximately $106 per square foot. 543 N Main St is a home located in Tuscarawas County with nearby schools including Midvale Elementary School, Tuscarawas Middle School, and Indian Valley High School.
Ownership History
Date
Name
Owned For
Owner Type
Purchase Details
Closed on
Aug 23, 2021
Sold by
Kellar Rita and Young Shelley
Bought by
Hartline Crystal and Hartline Kevin
Current Estimated Value
Home Financials for this Owner
Home Financials are based on the most recent Mortgage that was taken out on this home.
Original Mortgage
$134,911
Outstanding Balance
$123,992
Interest Rate
2.9%
Mortgage Type
FHA
Estimated Equity
$63,679
Create a Home Valuation Report for This Property
The Home Valuation Report is an in-depth analysis detailing your home's value as well as a comparison with similar homes in the area
Home Values in the Area
Average Home Value in this Area
Purchase History
| Date | Buyer | Sale Price | Title Company |
|---|---|---|---|
| Hartline Crystal | $137,400 | Ohio Real Title Agency Llc |
Source: Public Records
Mortgage History
| Date | Status | Borrower | Loan Amount |
|---|---|---|---|
| Open | Hartline Crystal | $134,911 | |
| Closed | Hartline Kevin | $134,911 | |
| Previous Owner | Kellar Rita K | $45,800 | |
| Previous Owner | Kellar David P | $53,000 | |
| Previous Owner | Kellar David P | $51,500 | |
| Previous Owner | Kellar David P | $52,000 |
Source: Public Records
Tax History Compared to Growth
Tax History
| Year | Tax Paid | Tax Assessment Tax Assessment Total Assessment is a certain percentage of the fair market value that is determined by local assessors to be the total taxable value of land and additions on the property. | Land | Improvement |
|---|---|---|---|---|
| 2024 | $1,994 | $142,100 | $16,660 | $125,440 |
| 2023 | $1,994 | $142,100 | $16,660 | $125,440 |
| 2022 | $1,981 | $49,735 | $5,831 | $43,904 |
| 2021 | $1,454 | $43,744 | $6,094 | $37,650 |
| 2020 | $1,464 | $43,639 | $5,989 | $37,650 |
| 2019 | $1,436 | $43,639 | $5,989 | $37,650 |
| 2018 | $1,328 | $39,250 | $5,390 | $33,860 |
| 2017 | $1,328 | $39,250 | $5,390 | $33,860 |
| 2016 | $1,339 | $39,250 | $5,390 | $33,860 |
| 2014 | $1,294 | $37,350 | $5,580 | $31,770 |
| 2013 | $1,278 | $37,350 | $5,580 | $31,770 |
Source: Public Records
Map
Nearby Homes
- 5182 Center Rd SE
- 308 Maple St
- 1961 Wainwright Rd SE
- 2833 Riverside Park Rd SE
- VL Wainwright Rd
- 2775 State Route 416 SE
- 4792 Gatchell Rd SE
- 108 N Wardell St
- 2131 Goshen Valley Rd SE
- 217 Mcconnell St
- 4618 Belden Dr SE
- 11638 3rd St
- 110 Kutcham Dr
- 1613 Roanoke Ave
- 5637 Gundy Dr
- 315 S Wallace St
- 317 S Wallace St
- 603 Trenton Ave
- 4602 Broadway St
- 2721 Vernon St