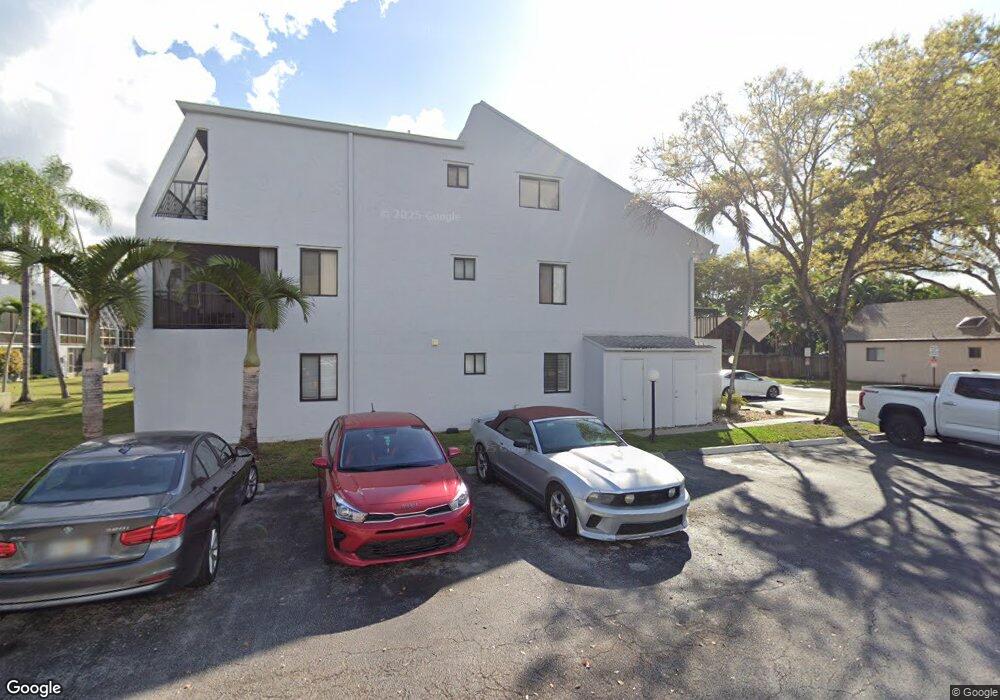
543 N University Dr Unit 67 Plantation, FL 33324
Estimated Value: $209,203 - $276,000
2
Beds
2
Baths
1,030
Sq Ft
$245/Sq Ft
Est. Value
About This Home
This home is located at 543 N University Dr Unit 67, Plantation, FL 33324 and is currently estimated at $252,301, approximately $244 per square foot. 543 N University Dr Unit 67 is a home located in Broward County with nearby schools including Peters Elementary School, Plantation Middle School, and Plantation High School.
Ownership History
Date
Name
Owned For
Owner Type
Purchase Details
Closed on
Apr 12, 2021
Sold by
Novas Luisa S
Bought by
Albeno Properties Iii Llc
Current Estimated Value
Purchase Details
Closed on
Feb 15, 2019
Sold by
Midfirst Bank
Bought by
Novas Luisa S
Purchase Details
Closed on
Jul 30, 2018
Sold by
Kropilnicki Walter J and Hinostroza Dinana L
Bought by
The Village Town Houses Jacaranda Inc
Purchase Details
Closed on
Dec 28, 2001
Sold by
Penney Keith
Bought by
Kropilnicki Walter J and Hinostroza Diana L
Home Financials for this Owner
Home Financials are based on the most recent Mortgage that was taken out on this home.
Original Mortgage
$78,085
Interest Rate
6.72%
Mortgage Type
FHA
Purchase Details
Closed on
Oct 1, 1981
Sold by
Available Not
Bought by
Available Not
Create a Home Valuation Report for This Property
The Home Valuation Report is an in-depth analysis detailing your home's value as well as a comparison with similar homes in the area
Home Values in the Area
Average Home Value in this Area
Purchase History
| Date | Buyer | Sale Price | Title Company |
|---|---|---|---|
| Albeno Properties Iii Llc | -- | None Available | |
| Novas Luisa S | $134,000 | Novare Natl Setmnt Svc Llc | |
| The Village Town Houses Jacaranda Inc | $26,900 | None Available | |
| Kropilnicki Walter J | $80,500 | Colonial Guaranty & Title In | |
| Available Not | $38,893 | -- |
Source: Public Records
Mortgage History
| Date | Status | Borrower | Loan Amount |
|---|---|---|---|
| Previous Owner | Kropilnicki Walter J | $78,085 |
Source: Public Records
Tax History Compared to Growth
Tax History
| Year | Tax Paid | Tax Assessment Tax Assessment Total Assessment is a certain percentage of the fair market value that is determined by local assessors to be the total taxable value of land and additions on the property. | Land | Improvement |
|---|---|---|---|---|
| 2025 | $3,876 | $198,880 | -- | -- |
| 2024 | $3,521 | $198,880 | $17,800 | $160,230 |
| 2023 | $3,521 | $164,370 | $0 | $0 |
| 2022 | $3,086 | $149,430 | $14,940 | $134,490 |
| 2021 | $2,539 | $122,810 | $12,280 | $110,530 |
| 2020 | $2,639 | $128,010 | $12,800 | $115,210 |
| 2019 | $2,479 | $119,260 | $11,930 | $107,330 |
| 2018 | $537 | $49,750 | $0 | $0 |
| 2017 | $523 | $48,730 | $0 | $0 |
| 2016 | $506 | $47,730 | $0 | $0 |
| 2015 | $511 | $47,400 | $0 | $0 |
| 2014 | $507 | $47,030 | $0 | $0 |
| 2013 | -- | $56,740 | $5,670 | $51,070 |
Source: Public Records
Map
Nearby Homes
- 559 N University Dr Unit 39
- 2781 N Pine Island Rd Unit 312
- 611 N University Dr Unit 3
- 521 N University Dr Unit 38
- 489 N University Dr Unit 1-6
- 502 Westree Ln
- 492 Westree Ln
- 540 NW 38th St
- 450 NW 79th Ave
- 510 NW 84th Ave Unit 507
- 510 NW 84th Ave Unit 445
- 510 NW 84th Ave Unit 324
- 510 NW 84th Ave Unit 417
- 510 NW 84th Ave Unit 528
- 510 NW 84th Ave Unit 541
- 510 NW 84th Ave Unit 303
- 510 NW 84th Ave Unit 420
- 510 NW 84th Ave Unit 121
- 510 NW 84th Ave Unit 339
- 7954 NW 7th Ct
- 539 N University Dr Unit 69
- 547 N University Dr Unit 66
- 537 N University Dr Unit 71
- 549 N University Dr Unit 64
- 553 N University Dr Unit 62
- 533 N University Dr Unit 72
- 2781 N Pine Island Rd Unit 309
- 2781 N Pine Island Rd Unit 209
- 2781 N Pine Island Rd Unit 203
- 2781 N Pine Island Rd Unit 104
- 2781 N Pine Island Rd Unit 301
- 2781 N Pine Island Rd Unit 308
- 2781 N Pine Island Rd Unit 110
- 2781 N Pine Island Rd Unit 109
- 2781 N Pine Island Rd Unit 108
- 2781 N Pine Island Rd Unit 208
- 2781 N Pine Island Rd Unit 206
- 2781 N Pine Island Rd Unit 103
- 2781 N Pine Island Rd Unit 305