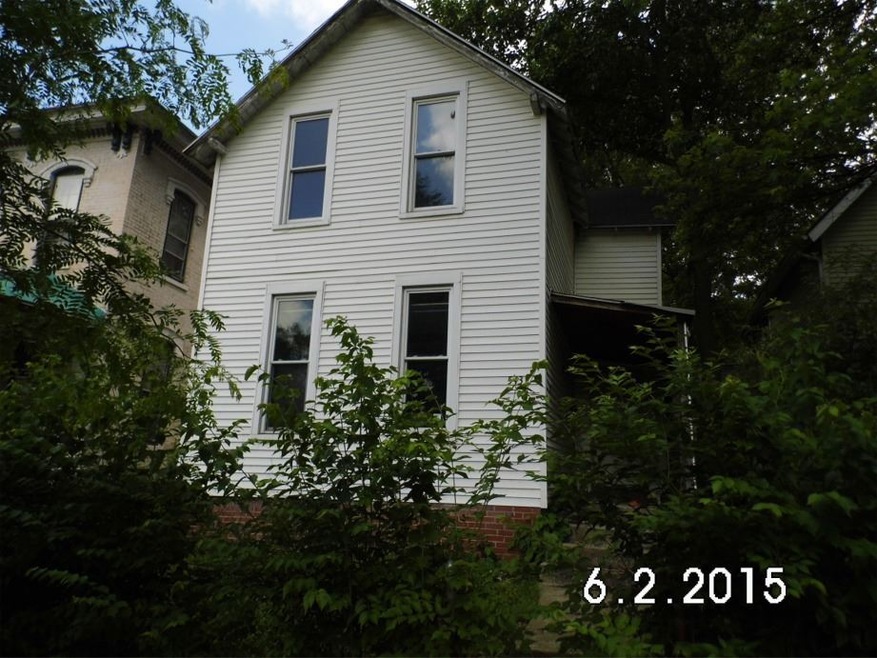
543 S 3rd St Lafayette, IN 47905
Ellsworth Romig NeighborhoodHighlights
- 1-Story Property
- Level Lot
- 1-minute walk to SIA South Tipp Park
About This Home
As of December 2021This property is now under auction terms. This property is subject to a 5% buyer's premium pursuant to the Auction Terms & Conditions (minimums may apply). Please contact the listing agent for commission and details, as commissions may change between the pre-sale and auction periods. This is a reserve auction and all offers are subject to seller approval. Please contact listing agent for details.
Last Buyer's Agent
ECBOR NonMember
NonMember ELK
Home Details
Home Type
- Single Family
Year Built
- Built in 1920
Lot Details
- 3,049 Sq Ft Lot
- Lot Dimensions are 25x132
- Level Lot
Home Design
- Vinyl Construction Material
Interior Spaces
- 1-Story Property
- Basement
- Basement Cellar
Bedrooms and Bathrooms
- 3 Bedrooms
Utilities
- Heating System Uses Gas
Listing and Financial Details
- Assessor Parcel Number 79-07-29-260-010.000-004
Ownership History
Purchase Details
Home Financials for this Owner
Home Financials are based on the most recent Mortgage that was taken out on this home.Purchase Details
Purchase Details
Home Financials for this Owner
Home Financials are based on the most recent Mortgage that was taken out on this home.Purchase Details
Home Financials for this Owner
Home Financials are based on the most recent Mortgage that was taken out on this home.Purchase Details
Map
Home Values in the Area
Average Home Value in this Area
Purchase History
| Date | Type | Sale Price | Title Company |
|---|---|---|---|
| Warranty Deed | $160,000 | Metropolitan Title | |
| Warranty Deed | -- | None Available | |
| Deed | -- | Columbia Title | |
| Warranty Deed | -- | -- | |
| Quit Claim Deed | $25,489 | -- |
Mortgage History
| Date | Status | Loan Amount | Loan Type |
|---|---|---|---|
| Open | $3,381 | FHA | |
| Open | $157,102 | FHA |
Property History
| Date | Event | Price | Change | Sq Ft Price |
|---|---|---|---|---|
| 12/17/2021 12/17/21 | Sold | $160,000 | 0.0% | $104 / Sq Ft |
| 11/13/2021 11/13/21 | Pending | -- | -- | -- |
| 11/09/2021 11/09/21 | For Sale | $160,000 | 0.0% | $104 / Sq Ft |
| 09/24/2021 09/24/21 | Pending | -- | -- | -- |
| 09/09/2021 09/09/21 | Price Changed | $160,000 | -3.0% | $104 / Sq Ft |
| 08/16/2021 08/16/21 | For Sale | $165,000 | +560.0% | $107 / Sq Ft |
| 04/27/2018 04/27/18 | Sold | $25,000 | -44.4% | $16 / Sq Ft |
| 04/12/2018 04/12/18 | Pending | -- | -- | -- |
| 10/18/2017 10/18/17 | For Sale | $45,000 | +260.0% | $29 / Sq Ft |
| 01/29/2016 01/29/16 | Sold | $12,500 | -74.9% | $8 / Sq Ft |
| 01/21/2016 01/21/16 | Pending | -- | -- | -- |
| 07/23/2015 07/23/15 | For Sale | $49,900 | -- | $32 / Sq Ft |
Tax History
| Year | Tax Paid | Tax Assessment Tax Assessment Total Assessment is a certain percentage of the fair market value that is determined by local assessors to be the total taxable value of land and additions on the property. | Land | Improvement |
|---|---|---|---|---|
| 2024 | $1,057 | $140,300 | $9,800 | $130,500 |
| 2023 | $1,057 | $130,400 | $9,800 | $120,600 |
| 2022 | $311 | $62,900 | $9,800 | $53,100 |
| 2021 | $385 | $61,700 | $9,800 | $51,900 |
| 2020 | $1,234 | $61,700 | $9,800 | $51,900 |
| 2019 | $1,186 | $59,300 | $10,000 | $49,300 |
| 2018 | $1,174 | $58,700 | $10,000 | $48,700 |
| 2017 | $1,168 | $58,400 | $10,000 | $48,400 |
| 2016 | $1,156 | $57,830 | $10,000 | $47,830 |
| 2014 | $1,192 | $59,600 | $10,000 | $49,600 |
| 2013 | $1,182 | $59,100 | $10,000 | $49,100 |
Source: Indiana Regional MLS
MLS Number: 201535912
APN: 79-07-29-260-010.000-004
