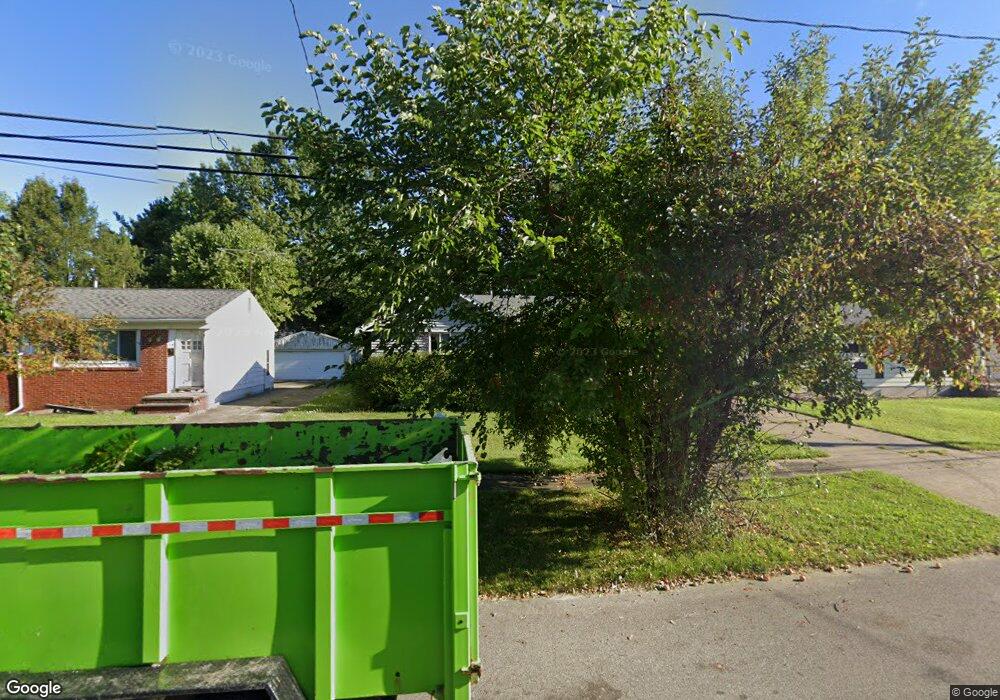
543 Walnut St Elyria, OH 44035
Estimated Value: $130,000 - $159,000
3
Beds
2
Baths
884
Sq Ft
$157/Sq Ft
Est. Value
About This Home
This home is located at 543 Walnut St, Elyria, OH 44035 and is currently estimated at $139,076, approximately $157 per square foot. 543 Walnut St is a home located in Lorain County with nearby schools including Westwood Middle School, Elyria High School, and St Mary Elementary School.
Ownership History
Date
Name
Owned For
Owner Type
Purchase Details
Closed on
Mar 13, 2024
Sold by
Sheriff Of Lorain County Ohio
Bought by
Williams Felicia R and Elkhatib Amin
Current Estimated Value
Purchase Details
Closed on
Jul 10, 2006
Sold by
Tate Ronald F and Tate Ronald Fred
Bought by
Williams Jerome E and Williams Felicia R
Home Financials for this Owner
Home Financials are based on the most recent Mortgage that was taken out on this home.
Original Mortgage
$77,000
Interest Rate
6.72%
Mortgage Type
Purchase Money Mortgage
Create a Home Valuation Report for This Property
The Home Valuation Report is an in-depth analysis detailing your home's value as well as a comparison with similar homes in the area
Home Values in the Area
Average Home Value in this Area
Purchase History
| Date | Buyer | Sale Price | Title Company |
|---|---|---|---|
| Williams Felicia R | $89,200 | None Listed On Document | |
| Williams Jerome E | $77,000 | Real Estate Title |
Source: Public Records
Mortgage History
| Date | Status | Borrower | Loan Amount |
|---|---|---|---|
| Previous Owner | Williams Jerome E | $77,000 |
Source: Public Records
Tax History
| Year | Tax Paid | Tax Assessment Tax Assessment Total Assessment is a certain percentage of the fair market value that is determined by local assessors to be the total taxable value of land and additions on the property. | Land | Improvement |
|---|---|---|---|---|
| 2024 | $2,042 | $43,148 | $6,682 | $36,467 |
| 2023 | $1,516 | $27,080 | $6,171 | $20,909 |
| 2022 | $1,495 | $27,080 | $6,171 | $20,909 |
| 2021 | $1,506 | $27,080 | $6,170 | $20,910 |
| 2020 | $1,415 | $22,610 | $5,150 | $17,460 |
| 2019 | $1,423 | $22,610 | $5,150 | $17,460 |
| 2018 | $1,377 | $22,610 | $5,150 | $17,460 |
| 2017 | $1,236 | $19,450 | $3,630 | $15,820 |
| 2016 | $1,220 | $19,450 | $3,630 | $15,820 |
| 2015 | $1,143 | $19,450 | $3,630 | $15,820 |
| 2014 | $1,188 | $20,470 | $3,820 | $16,650 |
| 2013 | $1,177 | $20,470 | $3,820 | $16,650 |
Source: Public Records
Map
Nearby Homes
Your Personal Tour Guide
Ask me questions while you tour the home.