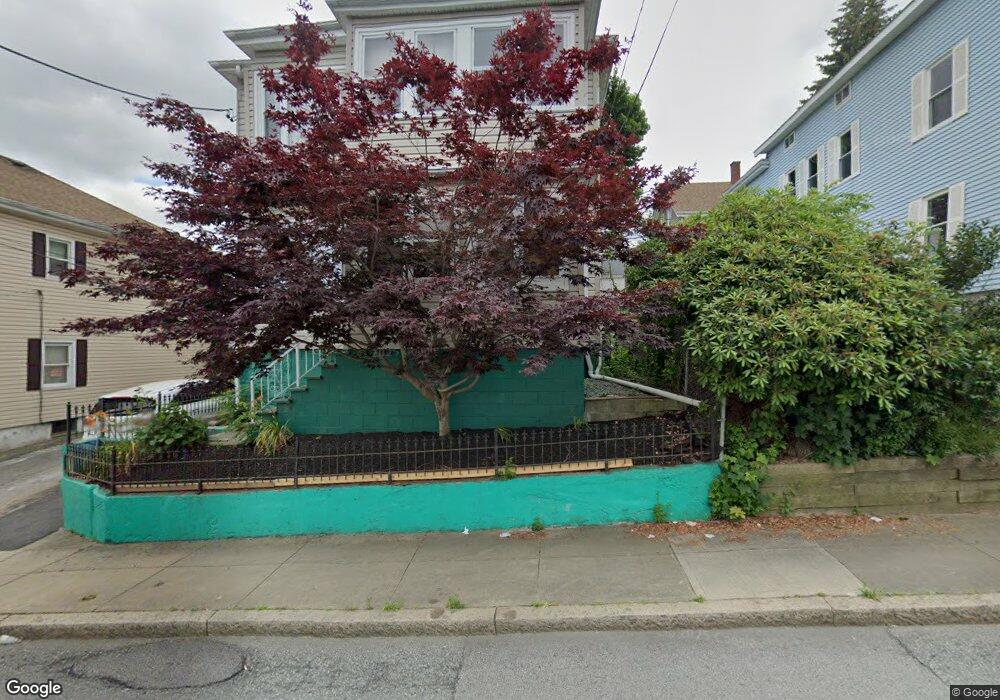
543 Warren St Fall River, MA 02721
Niagara NeighborhoodEstimated Value: $272,000 - $388,000
3
Beds
1
Bath
858
Sq Ft
$392/Sq Ft
Est. Value
About This Home
This home is located at 543 Warren St, Fall River, MA 02721 and is currently estimated at $335,936, approximately $391 per square foot. 543 Warren St is a home located in Bristol County with nearby schools including William S Greene, Matthew J. Kuss Middle School, and B M C Durfee High School.
Ownership History
Date
Name
Owned For
Owner Type
Purchase Details
Closed on
Aug 19, 2011
Sold by
Innovative Investments
Bought by
Potvin Bernice J
Current Estimated Value
Home Financials for this Owner
Home Financials are based on the most recent Mortgage that was taken out on this home.
Original Mortgage
$98,439
Outstanding Balance
$68,316
Interest Rate
4.62%
Mortgage Type
Purchase Money Mortgage
Estimated Equity
$267,620
Purchase Details
Closed on
Jun 16, 2010
Sold by
Rosa Karen C
Bought by
Fhlmc
Purchase Details
Closed on
Jan 13, 2005
Sold by
Heneghen Guy
Bought by
Rosa Karen C and Rosa Paul F
Home Financials for this Owner
Home Financials are based on the most recent Mortgage that was taken out on this home.
Original Mortgage
$138,400
Interest Rate
5.81%
Mortgage Type
Purchase Money Mortgage
Purchase Details
Closed on
Apr 5, 1999
Sold by
Britland R Glenn
Bought by
Heneghen Guy
Purchase Details
Closed on
Oct 28, 1997
Sold by
Nowacki Jennie V and Nowack Gdn Albert J
Bought by
Haneghen Guy and Glenn Britland R
Create a Home Valuation Report for This Property
The Home Valuation Report is an in-depth analysis detailing your home's value as well as a comparison with similar homes in the area
Home Values in the Area
Average Home Value in this Area
Purchase History
| Date | Buyer | Sale Price | Title Company |
|---|---|---|---|
| Potvin Bernice J | $101,000 | -- | |
| Fhlmc | $75,600 | -- | |
| Rosa Karen C | $173,000 | -- | |
| Heneghen Guy | $39,000 | -- | |
| Haneghen Guy | $26,000 | -- |
Source: Public Records
Mortgage History
| Date | Status | Borrower | Loan Amount |
|---|---|---|---|
| Open | Potvin Bernice J | $98,439 | |
| Previous Owner | Haneghen Guy | $73,000 | |
| Previous Owner | Haneghen Guy | $138,400 |
Source: Public Records
Tax History
| Year | Tax Paid | Tax Assessment Tax Assessment Total Assessment is a certain percentage of the fair market value that is determined by local assessors to be the total taxable value of land and additions on the property. | Land | Improvement |
|---|---|---|---|---|
| 2025 | $2,680 | $234,100 | $106,100 | $128,000 |
| 2024 | $2,505 | $218,000 | $102,200 | $115,800 |
| 2023 | $2,388 | $194,600 | $84,500 | $110,100 |
| 2022 | $2,123 | $168,200 | $80,400 | $87,800 |
| 2021 | $2,047 | $148,000 | $76,500 | $71,500 |
| 2020 | $1,795 | $124,200 | $75,400 | $48,800 |
| 2019 | $1,687 | $115,700 | $72,600 | $43,100 |
| 2018 | $1,791 | $122,500 | $78,700 | $43,800 |
| 2017 | $1,694 | $121,000 | $75,000 | $46,000 |
| 2016 | $1,681 | $123,300 | $79,800 | $43,500 |
| 2015 | $1,613 | $123,300 | $79,800 | $43,500 |
| 2014 | $1,521 | $120,900 | $77,400 | $43,500 |
Source: Public Records
Map
Nearby Homes
- 71 Smith St
- 472 Buffinton St (Ns)
- 405 Warren St
- 472 Buffinton St
- 304 Cambridge St
- 20 Reeves St
- 1350 Rodman St
- 364 Tecumseh St
- 231 Lapham St
- 21 Boyden St
- 000 Lawrence St
- 1-11 Lawrence St
- 1 Lawrence St Unit 1
- 545 Brayton Ave
- 188-194 Nashua St
- 10 Aberdeen St
- 311 S Oxford St
- 11 Foster St
- 118 Jefferson St
- 132 Lonsdale St
- 551 Warren St
- 136 Smith St
- 539 Warren St
- 148 Smith St
- 529 Warren St
- 529 Warren St Unit 1
- 143 Baker St
- 147 Baker St
- 129 Baker St
- 129 Baker St Unit 3
- 129 Baker St Unit 2
- 123 Baker St
- 166 Smith St
- 165 Baker St
- 532 Warren St Unit 1
- 159 Baker St
- 139 Smith St
- 100 Smith St
- 100 Smith St Unit 2
- 100 Smith St Unit 1
Your Personal Tour Guide
Ask me questions while you tour the home.