Estimated Value: $467,000 - $505,000
3
Beds
2
Baths
1,685
Sq Ft
$287/Sq Ft
Est. Value
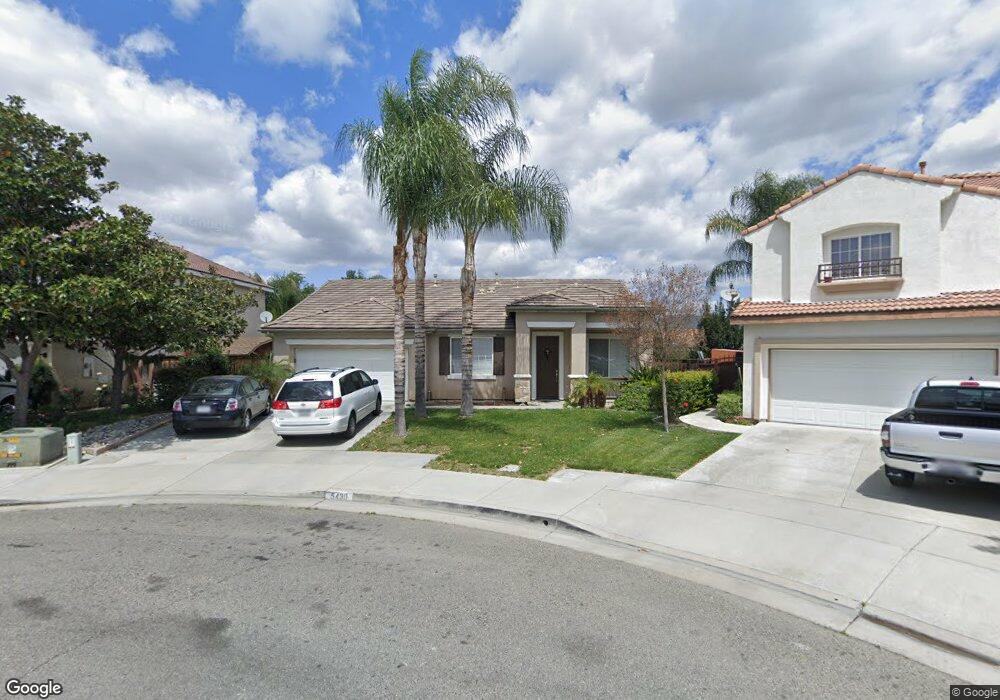
About This Home
This home is located at 5430 Pacific Green Ct, Hemet, CA 92544 and is currently estimated at $484,146, approximately $287 per square foot. 5430 Pacific Green Ct is a home located in Riverside County with nearby schools including Bautista Creek Elementary School, Acacia Middle School, and Hemet High School.
Ownership History
Date
Name
Owned For
Owner Type
Purchase Details
Closed on
Mar 22, 2013
Sold by
Sanchez Rogaciano
Bought by
Sanchez Ymelda
Current Estimated Value
Home Financials for this Owner
Home Financials are based on the most recent Mortgage that was taken out on this home.
Original Mortgage
$157,102
Outstanding Balance
$110,662
Interest Rate
3.5%
Mortgage Type
FHA
Estimated Equity
$373,484
Purchase Details
Closed on
Apr 13, 2011
Sold by
Yost Gerald K and Yost Suzanne B
Bought by
Yost Gerald K and Yost Suzanne B
Purchase Details
Closed on
Jun 2, 2009
Sold by
Catron Su Ann
Bought by
Yost Gerald K and Yost Suzanne B
Purchase Details
Closed on
Sep 28, 2001
Sold by
Hpr Homes Llc
Bought by
Catron Su Ann
Home Financials for this Owner
Home Financials are based on the most recent Mortgage that was taken out on this home.
Original Mortgage
$153,579
Interest Rate
6.8%
Mortgage Type
FHA
Create a Home Valuation Report for This Property
The Home Valuation Report is an in-depth analysis detailing your home's value as well as a comparison with similar homes in the area
Purchase History
| Date | Buyer | Sale Price | Title Company |
|---|---|---|---|
| Sanchez Ymelda | -- | First American Title Company | |
| Sanchez Ricardo | $167,500 | First American Title Company | |
| Yost Gerald K | -- | None Available | |
| Yost Gerald K | $160,000 | Chicago Title Insurance Co | |
| Catron Su Ann | $156,000 | First American Title Co |
Source: Public Records
Mortgage History
| Date | Status | Borrower | Loan Amount |
|---|---|---|---|
| Open | Sanchez Ricardo | $157,102 | |
| Previous Owner | Catron Su Ann | $153,579 |
Source: Public Records
Tax History
| Year | Tax Paid | Tax Assessment Tax Assessment Total Assessment is a certain percentage of the fair market value that is determined by local assessors to be the total taxable value of land and additions on the property. | Land | Improvement |
|---|---|---|---|---|
| 2025 | $2,454 | $206,250 | $43,092 | $163,158 |
| 2023 | $2,454 | $198,243 | $41,420 | $156,823 |
| 2022 | $2,369 | $194,357 | $40,608 | $153,749 |
| 2021 | $2,327 | $190,547 | $39,812 | $150,735 |
| 2020 | $2,300 | $188,594 | $39,404 | $149,190 |
| 2019 | $2,250 | $184,897 | $38,632 | $146,265 |
| 2018 | $2,181 | $181,273 | $37,876 | $143,397 |
| 2017 | $2,147 | $177,720 | $37,134 | $140,586 |
| 2016 | $2,130 | $174,236 | $36,406 | $137,830 |
| 2015 | $2,122 | $171,620 | $35,860 | $135,760 |
| 2014 | $2,027 | $168,259 | $35,158 | $133,101 |
Source: Public Records
Map
Nearby Homes
- 5473 Charlton Ave
- 25186 Lake St
- 25343 Auld Ave
- 5323 Orange Grove Ave
- 43125 Andrade Ave
- 42874 Berkley Ave
- 42751 E Florida Ave Unit 146
- 42751 E Florida Ave Unit 19
- 42751 E Florida Ave Unit 163
- 42751 E Florida Ave Unit 154
- 4822 E Lincoln Ave
- 43195 Andrade Ave Unit L
- 25644 Sharp Dr Unit J
- 42751 Florida Ave Unit 126
- 42751 California 74 Unit 71
- 144 Zolder St
- 25306 Howard Dr
- 880 N Lake St Unit 69
- 880 N Lake St Unit 20
- 880 N Lake St Unit 83
- 5450 Pacific Green Ct
- 5410 Pacific Green Ct
- 409 Sutro Ct
- 410 Sutro Ct
- 5388 Pacific Green Ct
- 411 Lombard Ct
- 5449 Pacific Green Ct
- 422 Sutro Ct
- 421 Sutro Ct
- 5368 Pacific Green Ct
- 5429 Pacific Green Ct
- 403 Lombard Ct
- 394 Pamela Ct
- 5409 Pacific Green Ct
- 427 Lombard Ct
- 5348 Pacific Green Ct
- 434 Sutro Ct
- 435 Sutro Ct
- 435 Lombard Ct
- 376 Pamela Ct
Your Personal Tour Guide
Ask me questions while you tour the home.