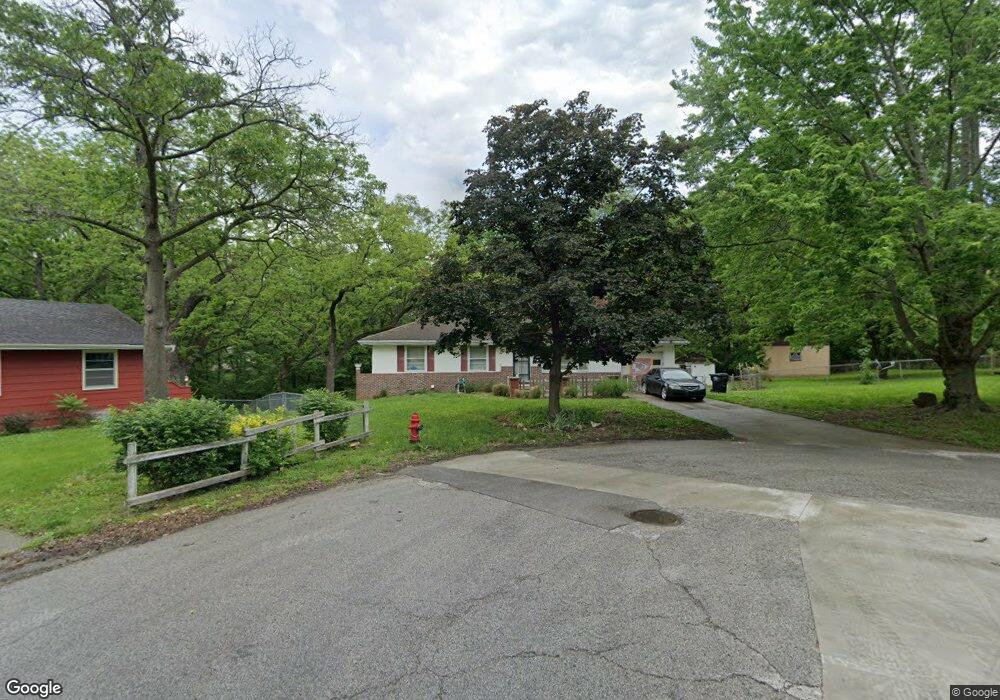
5431 Cedar Ave Raytown, MO 64133
Estimated Value: $169,595 - $218,000
3
Beds
1
Bath
1,008
Sq Ft
$181/Sq Ft
Est. Value
About This Home
This home is located at 5431 Cedar Ave, Raytown, MO 64133 and is currently estimated at $182,649, approximately $181 per square foot. 5431 Cedar Ave is a home located in Jackson County with nearby schools including Laurel Hills Elementary, Raytown Middle School, and Raytown South High School.
Ownership History
Date
Name
Owned For
Owner Type
Purchase Details
Closed on
Jun 30, 2021
Sold by
Scarlett James Craig and Scarlett Janene E
Bought by
Calderon Maria D
Current Estimated Value
Purchase Details
Closed on
Dec 20, 2002
Sold by
Scarlett James L and Scarlett Patty J
Bought by
Scarlett James C
Purchase Details
Closed on
Aug 21, 2002
Sold by
Hud
Bought by
Scarlett James L and Scarlett Patty J
Home Financials for this Owner
Home Financials are based on the most recent Mortgage that was taken out on this home.
Original Mortgage
$87,290
Interest Rate
6.33%
Mortgage Type
FHA
Purchase Details
Closed on
Apr 17, 2002
Sold by
Bank Of America Fsb
Bought by
Hud
Purchase Details
Closed on
Jul 24, 1998
Sold by
Pate Roger D and Pate Wf
Bought by
Suydam Rodney C and Suydam Kara K
Home Financials for this Owner
Home Financials are based on the most recent Mortgage that was taken out on this home.
Original Mortgage
$79,755
Interest Rate
7.05%
Mortgage Type
FHA
Create a Home Valuation Report for This Property
The Home Valuation Report is an in-depth analysis detailing your home's value as well as a comparison with similar homes in the area
Home Values in the Area
Average Home Value in this Area
Purchase History
| Date | Buyer | Sale Price | Title Company |
|---|---|---|---|
| Calderon Maria D | -- | None Available | |
| Scarlett James C | -- | -- | |
| Scarlett James L | -- | Mississippi Valley Title | |
| Hud | -- | -- | |
| Bank Of America Fsb | $84,739 | Mokan Title Services | |
| Suydam Rodney C | -- | -- |
Source: Public Records
Mortgage History
| Date | Status | Borrower | Loan Amount |
|---|---|---|---|
| Previous Owner | Scarlett James L | $87,290 | |
| Previous Owner | Suydam Rodney C | $79,755 |
Source: Public Records
Tax History
| Year | Tax Paid | Tax Assessment Tax Assessment Total Assessment is a certain percentage of the fair market value that is determined by local assessors to be the total taxable value of land and additions on the property. | Land | Improvement |
|---|---|---|---|---|
| 2025 | $1,478 | $18,837 | $3,886 | $14,951 |
| 2024 | $1,468 | $16,380 | $3,021 | $13,359 |
| 2023 | $1,468 | $16,380 | $2,749 | $13,631 |
| 2022 | $1,519 | $16,150 | $4,161 | $11,989 |
| 2021 | $1,524 | $16,150 | $4,161 | $11,989 |
| 2020 | $1,531 | $16,061 | $4,161 | $11,900 |
| 2019 | $1,522 | $16,061 | $4,161 | $11,900 |
| 2018 | $871,822 | $15,075 | $3,380 | $11,695 |
| 2017 | $1,380 | $15,075 | $3,380 | $11,695 |
| 2016 | $1,338 | $14,698 | $2,936 | $11,762 |
Source: Public Records
Map
Nearby Homes
- 5315 Ash Ave
- 5433 Willow Ave
- Lot 6 Crownover Acres N A
- Lot 8 Crownover Acres N A
- 5220 Overton Ave
- 5212 Hedges Ave
- 5110 Willow Ave
- 5425 Appleton Ave
- 9409 E 57th St
- 10600 E 51st St
- 11013 E 53rd Terrace
- 9532 E 58th St
- 9501 E 57th Terrace
- 9528 E 58th St
- 9524 E 58th St
- 9808 E 59th Terrace
- 5709 Elm Ave
- 5725 Elm Ave
- 9101 E 55th St
- 5801 Elm Ave
- 5435 Cedar Ave
- 5428 Cedar Ave
- 5432 Cedar Ave
- 5436 Cedar Ave
- 5501 Cedar Ave
- 5500 Cedar Ave
- 5414 Maywood Ave
- 5504 Cedar Ave
- 5412 Maywood Ave
- 5410 Maywood Ave
- 5404 Maywood Ave
- 5505 Cedar Ave
- 5416 Maywood Ave
- 5432 Maywood Ave
- 5436 Maywood Ave
- 5508 Cedar Ave
- 5420 Maywood Ave
- 5509 Cedar Ave
- 5400 Maywood Ave
- 10200 E 55th St
Your Personal Tour Guide
Ask me questions while you tour the home.