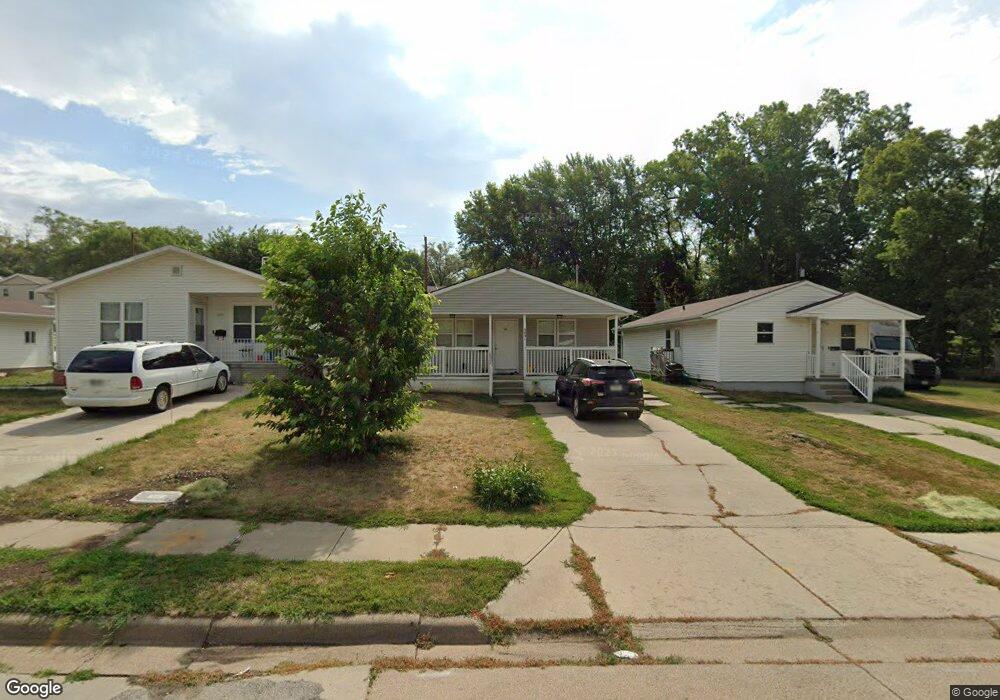
5431 N 35th St Omaha, NE 68111
Miller Park-Minne-Lusa NeighborhoodEstimated Value: $151,000 - $213,000
3
Beds
1
Bath
1,092
Sq Ft
$160/Sq Ft
Est. Value
About This Home
This home is located at 5431 N 35th St, Omaha, NE 68111 and is currently estimated at $174,821, approximately $160 per square foot. 5431 N 35th St is a home located in Douglas County with nearby schools including Belvedere Elementary School, McMillan Middle School, and North High School.
Ownership History
Date
Name
Owned For
Owner Type
Purchase Details
Closed on
Dec 22, 2010
Sold by
Habitat For Humanity Of Omaha Inc
Bought by
Eh Ser Gay and Mu Paw Swar
Current Estimated Value
Home Financials for this Owner
Home Financials are based on the most recent Mortgage that was taken out on this home.
Original Mortgage
$66,783
Outstanding Balance
$44,032
Interest Rate
4.18%
Mortgage Type
Seller Take Back
Estimated Equity
$130,789
Purchase Details
Closed on
Aug 6, 2010
Sold by
Jack Benjeana F and Jack Mark A
Bought by
Habitat For Humanity Of Omaha Inc
Purchase Details
Closed on
Apr 10, 2002
Sold by
Omaha Habitat For Humanity Inc
Bought by
Harrison Rich Benjeana
Home Financials for this Owner
Home Financials are based on the most recent Mortgage that was taken out on this home.
Original Mortgage
$56,036
Interest Rate
6.8%
Mortgage Type
Seller Take Back
Create a Home Valuation Report for This Property
The Home Valuation Report is an in-depth analysis detailing your home's value as well as a comparison with similar homes in the area
Home Values in the Area
Average Home Value in this Area
Purchase History
| Date | Buyer | Sale Price | Title Company |
|---|---|---|---|
| Eh Ser Gay | $75,000 | None Available | |
| Habitat For Humanity Of Omaha Inc | $59,000 | None Available | |
| Harrison Rich Benjeana | $59,000 | -- |
Source: Public Records
Mortgage History
| Date | Status | Borrower | Loan Amount |
|---|---|---|---|
| Open | Eh Ser Gay | $66,783 | |
| Previous Owner | Harrison Rich Benjeana | $56,036 | |
| Closed | Harrison Rich Benjeana | $3,500 |
Source: Public Records
Tax History Compared to Growth
Tax History
| Year | Tax Paid | Tax Assessment Tax Assessment Total Assessment is a certain percentage of the fair market value that is determined by local assessors to be the total taxable value of land and additions on the property. | Land | Improvement |
|---|---|---|---|---|
| 2024 | $2,502 | $139,400 | $5,800 | $133,600 |
| 2023 | $2,502 | $118,600 | $5,800 | $112,800 |
| 2022 | $2,320 | $108,700 | $5,800 | $102,900 |
| 2021 | $1,778 | $84,000 | $5,800 | $78,200 |
| 2020 | $1,798 | $84,000 | $5,800 | $78,200 |
| 2019 | $1,409 | $65,600 | $700 | $64,900 |
| 2018 | $1,013 | $47,100 | $700 | $46,400 |
| 2017 | $1,145 | $53,000 | $700 | $52,300 |
| 2016 | $1,253 | $58,400 | $600 | $57,800 |
| 2015 | $1,594 | $75,300 | $3,200 | $72,100 |
| 2014 | $1,594 | $75,300 | $3,200 | $72,100 |
Source: Public Records
Map
Nearby Homes
- 5322 N 36th Ave
- 5422 N 33rd Ave
- 5424 N 33rd Ave
- 5518 N 34th St
- 5353 N 33rd Ave
- 4972 N 35th St
- 5117 N 36th St
- 5154 N 37th St
- 5150 N 37th St
- 5146 N 37th St
- 5525 N 33rd Ave
- 5126 N 37th St
- 4955 N 35th St
- 5115 N 37th Ave
- 4940 N 35th St
- 5730 N 35th St
- 5215 N 38th St
- 4936 N 35th St
- 4931 N 35th St
- 3616 Himebaugh Ave