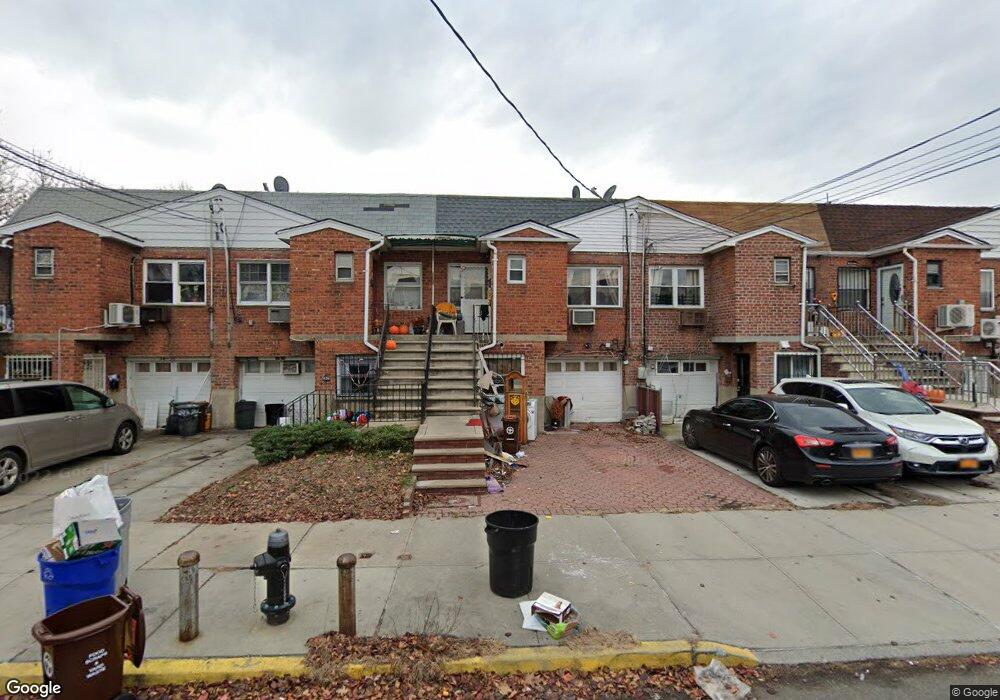
5432 153rd St Unit 2 Flushing, NY 11355
Queensboro Hill NeighborhoodEstimated Value: $1,011,590 - $1,215,000
3
Beds
2
Baths
1,429
Sq Ft
$792/Sq Ft
Est. Value
About This Home
This home is located at 5432 153rd St Unit 2, Flushing, NY 11355 and is currently estimated at $1,131,148, approximately $791 per square foot. 5432 153rd St Unit 2 is a home located in Queens County with nearby schools including P.S. 024 Andrew Jackson School, Rachel Carson I.S. 237Q, and John Bowne High School.
Ownership History
Date
Name
Owned For
Owner Type
Purchase Details
Closed on
Jun 23, 2022
Sold by
Kwok Ying Chun
Bought by
Chen Kong Cheng and Li Hong Fei
Current Estimated Value
Home Financials for this Owner
Home Financials are based on the most recent Mortgage that was taken out on this home.
Original Mortgage
$466,000
Outstanding Balance
$442,699
Interest Rate
5.09%
Mortgage Type
Purchase Money Mortgage
Estimated Equity
$688,449
Purchase Details
Closed on
Oct 9, 2020
Sold by
Khasria Harpreet
Bought by
Kwok Ying Chun
Home Financials for this Owner
Home Financials are based on the most recent Mortgage that was taken out on this home.
Original Mortgage
$595,000
Interest Rate
2.8%
Mortgage Type
New Conventional
Purchase Details
Closed on
Oct 23, 2017
Sold by
Khasria Harpreet and Singh Balwinder
Bought by
Khasria Harpreet
Purchase Details
Closed on
May 30, 2006
Sold by
Mirza Waseem and Mirza Wasi
Bought by
Khasria Harpreet and Singh Balwinder
Home Financials for this Owner
Home Financials are based on the most recent Mortgage that was taken out on this home.
Original Mortgage
$440,000
Interest Rate
6.62%
Mortgage Type
Purchase Money Mortgage
Create a Home Valuation Report for This Property
The Home Valuation Report is an in-depth analysis detailing your home's value as well as a comparison with similar homes in the area
Home Values in the Area
Average Home Value in this Area
Purchase History
| Date | Buyer | Sale Price | Title Company |
|---|---|---|---|
| Chen Kong Cheng | $1,166,000 | -- | |
| Kwok Ying Chun | $850,000 | -- | |
| Khasria Harpreet | -- | -- | |
| Khasria Harpreet | $550,000 | -- |
Source: Public Records
Mortgage History
| Date | Status | Borrower | Loan Amount |
|---|---|---|---|
| Open | Chen Kong Cheng | $466,000 | |
| Previous Owner | Kwok Ying Chun | $595,000 | |
| Previous Owner | Khasria Harpreet | $440,000 |
Source: Public Records
Tax History
| Year | Tax Paid | Tax Assessment Tax Assessment Total Assessment is a certain percentage of the fair market value that is determined by local assessors to be the total taxable value of land and additions on the property. | Land | Improvement |
|---|---|---|---|---|
| 2025 | $7,689 | $40,309 | $6,666 | $33,643 |
| 2024 | $7,689 | $38,280 | $6,714 | $31,566 |
| 2023 | $7,689 | $38,280 | $6,481 | $31,799 |
| 2022 | $7,591 | $59,760 | $10,260 | $49,500 |
| 2021 | $6,668 | $55,320 | $10,260 | $45,060 |
| 2020 | $6,327 | $54,240 | $10,260 | $43,980 |
| 2019 | $5,899 | $49,920 | $10,260 | $39,660 |
| 2018 | $5,749 | $28,200 | $5,909 | $22,291 |
| 2017 | $5,705 | $27,986 | $6,502 | $21,484 |
| 2016 | $5,278 | $27,986 | $6,502 | $21,484 |
| 2015 | $2,965 | $24,909 | $7,074 | $17,835 |
| 2014 | $2,965 | $23,500 | $7,847 | $15,653 |
Source: Public Records
Map
Nearby Homes
- 54-29 153rd St
- 54-23 153rd St
- 54-26 152nd St
- 152-10 Peck Ave
- 152-12 Peck Ave
- 140-19 Rose Ave
- 14014 Poplar Ave
- 52-05 Robinson St
- 14849 58th Rd
- 58-33 150th St
- 14214 Quince Ave
- 52-06 Bowne St
- 150-12 59th Ave
- 59-09 Kissena Blvd
- 150-40 60th Ave
- 14839 60th Ave
- 148-10 59th Ave
- 46-40 Kissena Blvd
- 150-01 Horace Harding Expy
- 153-51 Horace Harding Expy
- 5432 153rd St
- 5432 153rd St Unit 1
- 5432 153rd St
- 5430 153rd St
- 54-34 153rd St
- 5434 153rd St
- 54-30 153rd St Unit 2nd FL
- 54-30 153rd St
- 5428 153rd St
- 5436 153rd St
- 54-36 153 St
- 5436 153rd St
- 5426 153rd St
- 5424 153rd St
- 5424 153rd St Unit 2Fl
- 5424 153rd St
- 5422 153rd St
- 5429 152nd St
- 5431 152nd St
- 5425 152nd St
Your Personal Tour Guide
Ask me questions while you tour the home.