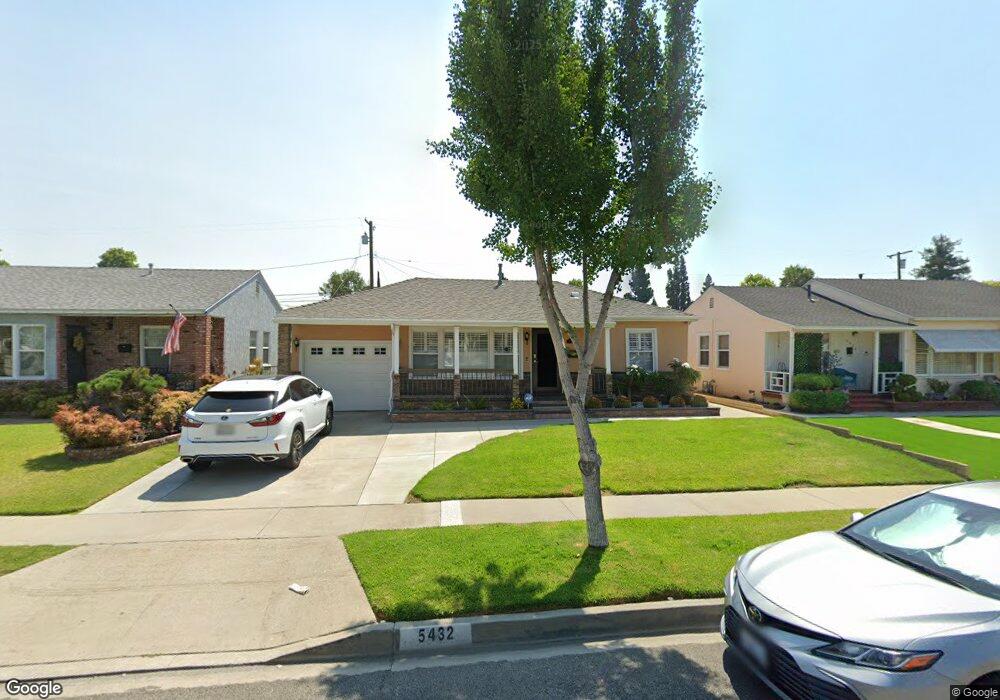
5432 Hayter Ave Lakewood, CA 90712
Lakewood Mutual NeighborhoodEstimated Value: $830,586 - $1,001,000
3
Beds
2
Baths
1,210
Sq Ft
$733/Sq Ft
Est. Value
About This Home
This home is located at 5432 Hayter Ave, Lakewood, CA 90712 and is currently estimated at $886,397, approximately $732 per square foot. 5432 Hayter Ave is a home located in Los Angeles County with nearby schools including Captain Raymond Collins School, Leona Jackson Middle School, and Buena Vista High School.
Ownership History
Date
Name
Owned For
Owner Type
Purchase Details
Closed on
Nov 25, 2002
Sold by
Tiryaki Susana M
Bought by
Mendoza Rodolfo and Mendoza Yolanda
Current Estimated Value
Home Financials for this Owner
Home Financials are based on the most recent Mortgage that was taken out on this home.
Original Mortgage
$276,000
Outstanding Balance
$116,164
Interest Rate
5.96%
Estimated Equity
$770,233
Purchase Details
Closed on
Jan 23, 2001
Sold by
Tiryaki Murat
Bought by
Tiryaki Susana M
Purchase Details
Closed on
Jan 28, 1997
Sold by
Paullus Tommy A
Bought by
Tiryaki Murat and Tiryaki Susana
Home Financials for this Owner
Home Financials are based on the most recent Mortgage that was taken out on this home.
Original Mortgage
$138,003
Interest Rate
7.86%
Mortgage Type
FHA
Create a Home Valuation Report for This Property
The Home Valuation Report is an in-depth analysis detailing your home's value as well as a comparison with similar homes in the area
Home Values in the Area
Average Home Value in this Area
Purchase History
| Date | Buyer | Sale Price | Title Company |
|---|---|---|---|
| Mendoza Rodolfo | $276,000 | Lawyers Title Company | |
| Tiryaki Susana M | -- | -- | |
| Tiryaki Murat | $140,000 | North American Title Co |
Source: Public Records
Mortgage History
| Date | Status | Borrower | Loan Amount |
|---|---|---|---|
| Open | Mendoza Rodolfo | $276,000 | |
| Previous Owner | Tiryaki Murat | $138,003 |
Source: Public Records
Tax History Compared to Growth
Tax History
| Year | Tax Paid | Tax Assessment Tax Assessment Total Assessment is a certain percentage of the fair market value that is determined by local assessors to be the total taxable value of land and additions on the property. | Land | Improvement |
|---|---|---|---|---|
| 2025 | $5,906 | $453,283 | $319,781 | $133,502 |
| 2024 | $5,906 | $444,396 | $313,511 | $130,885 |
| 2023 | $5,791 | $435,683 | $307,364 | $128,319 |
| 2022 | $5,630 | $427,141 | $301,338 | $125,803 |
| 2021 | $5,496 | $418,767 | $295,430 | $123,337 |
| 2019 | $5,633 | $406,348 | $286,668 | $119,680 |
| 2018 | $5,211 | $398,382 | $281,048 | $117,334 |
| 2016 | $4,675 | $382,915 | $270,136 | $112,779 |
| 2015 | $4,406 | $377,164 | $266,079 | $111,085 |
| 2014 | $4,498 | $326,079 | $260,867 | $65,212 |
Source: Public Records
Map
Nearby Homes
- 5602 Verdura Ave
- 5672 Pepperwood Ave
- 3806 E Arabella St
- 4342 Arabella St
- 4944 Coke Ave
- 3711 E Hedda St
- 5944 Blackthorne Ave
- 5839 Faculty Ave
- 5450 N Paramount Blvd Unit 12
- 5503 Sunfield Ave
- 6034 Pepperwood Ave
- 6062 Pimenta Ave
- 4848 Oliva Ave
- 2918 Yearling St
- 2912 Yearling St
- 6142 Oliva Ave
- 4814 Hedda St
- 2922 Eckleson St
- 2739 Denmead St
- 2917 Del Amo Blvd
- 5436 Hayter Ave
- 5428 Hayter Ave
- 5442 Hayter Ave
- 5422 Hayter Ave
- 5433 Castana Ave
- 5437 Castana Ave
- 5427 Castana Ave
- 5443 Castana Ave
- 5423 Castana Ave
- 5502 Hayter Ave
- 5418 Hayter Ave
- 5433 Hayter Ave
- 5429 Hayter Ave
- 5439 Hayter Ave
- 5503 Castana Ave
- 5417 Castana Ave
- 5443 Hayter Ave
- 5423 Hayter Ave
- 5508 Hayter Ave
- 5412 Hayter Ave